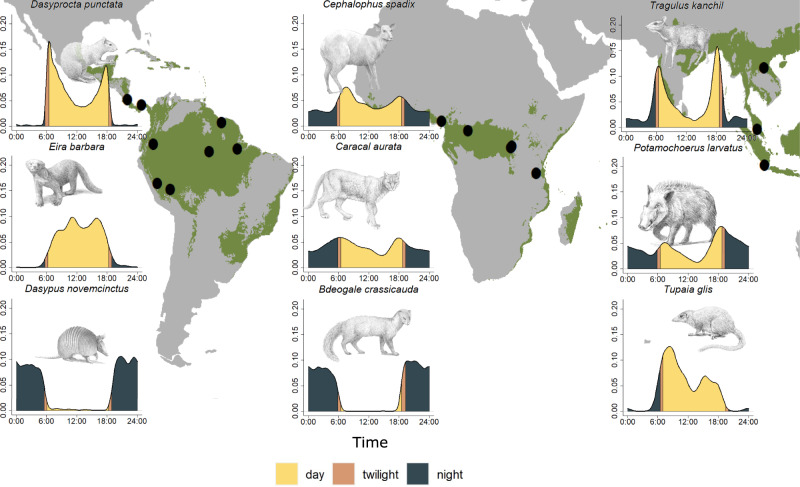
Fig. 2. Map of the study areas and activity density examples.
Mammal activity data were collected using the standardized TEAM camera-trapping protocol in 16 protected areas (black dots in background) situated in 14 countries and tropical forests (areas shaded green on the map in the background) in three biogeographic regions. Activity density plots in each column show examples of species in each region (from left to right: Neotropics, Afrotropics, and Indo-Malayan tropics). Illustrations by John Meaghan.

