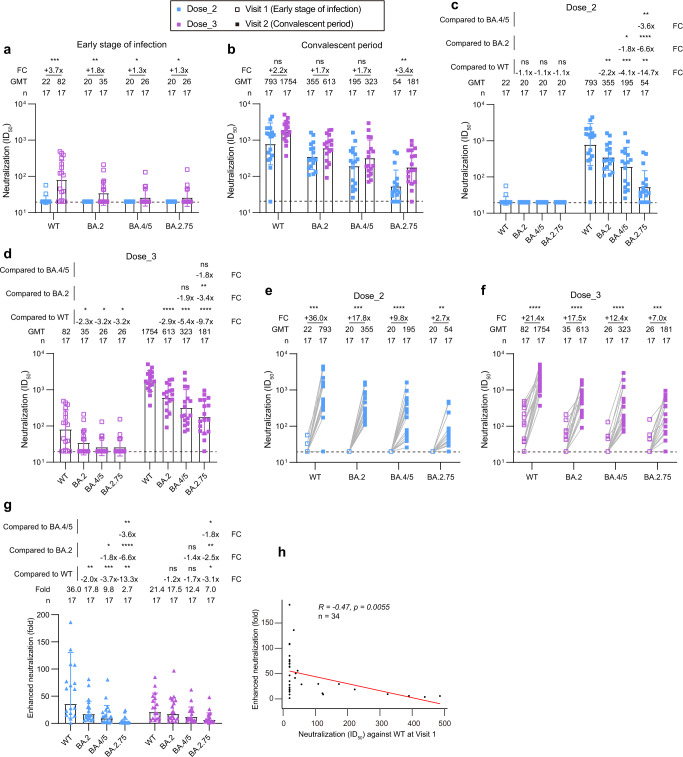
Fig. 2. Neutralization of SARS-CoV-2 Omicron subvariants by plasma from inactivated vaccine recipients infected with BA.2.
a, b Comparison of plasma neutralizing activities in different groups against WT SARS-CoV-2 and Omicron subvariants at Visit 1 (early stage of infection) (a) and Visit 2 (convalescent period) (b). c, d Neutralization titers against WT SARS-CoV-2 and Omicron subvariants in BA.2 breakthrough infected individuals with 2-dose (c) and 3-dose (d) inactivated vaccines. e, f Enhancement effects of neutralization against WT SARS-CoV-2 and Omicron subvariants by BA.2 breakthrough infection in 2-dose (e) and 3-dose (f) group. g Fold change in the enhanced neutralization of WT SARS-CoV-2 and Omicron subvariants by BA.2 breakthrough infection. h Correlation analysis between ID50 values against WT SARS-CoV-2 at Visit 1 and fold changes of enhanced neutralization in the 34 BA.2 breakthrough infected individuals. Perfect-fit correlation line was included on the plot. The non-parametric Spearman’s correlation coefficients (R) and statistically significant P value were provided. The ID50 values are means of at least two independent experiments. Data are presented as geometric mean values ± standard deviation (SD). The sample size, geometric mean, fold change, and significance of difference were labelled on the top. “-” represents decreased value and “+” represents increased value. Statistical significance was performed using two-tailed unpaired Wilcoxon test in (a, b), two-tailed Kruskal-Wallis test with paired Wilcoxon’s multiple-comparison test in (c, d, g), and two-tailed paired Wilcoxon test in (e, f). ****, P < 0.0001; ***, P < 0.001; **, P < 0.01; *, P < 0.05; ns, not significant. The dotted horizontal line in (a-f) indicates the limit of detection (1:20 dilution) for the neutralization assay. Non-neutralization data is set as 20 for analysis and visualization. ID50 indicates 50% inhibition dilution. GMT indicates geometric mean titer. FC indicates fold change. Source data and exact P values are provided as a Source Data file.

