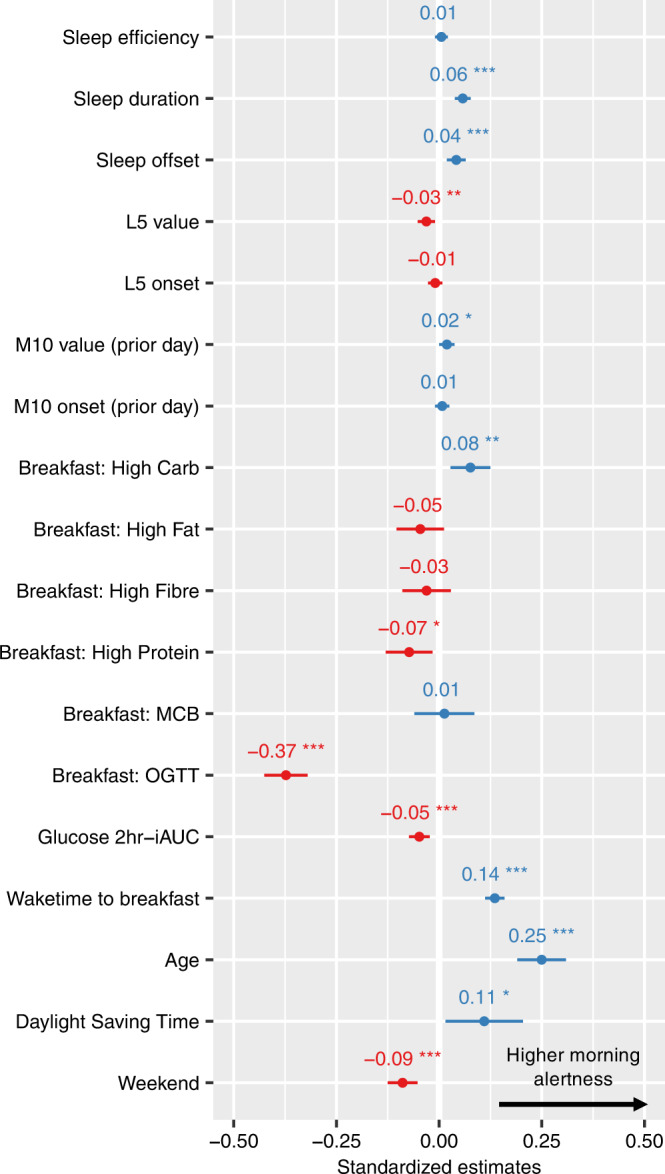
Fig. 3. Predictors of day-to-day fluctuations in morning alertness.

Standardised regression coefficients and confidence intervals from a linear mixed effect model. Sex, BMI, zygosity and sunrise time were also included in the model but are not reported here for conciseness since none of them was a significant predictor of morning alertness. Unstandardised regression coefficients and raw p-values can be found in Supplementary Table 1. Sleep predictors were normalised using person-mean centering. The dependent variable of the model is morning alertness, which is calculated by averaging the alertness ratings that were made within the first three hours after breakfast start (n = 6,744 observations). Family ID and participant ID were defined as nested random effects of the linear mixed model. Predictors with a positive coefficient (i.e predicting higher morning alertness) are shown in blue, while those with a negative coefficient (lower morning alertness) are shown in red. Error bars represent 95% confidence intervals. Stars indicate significance. P-values are based on two-tailed Wald tests (degrees of freedom = 6717) and are not adjusted for multiple comparisons. *p < 0.05, **p < 0.01, ***p < 0.001. L5 = least active 5 hours of the day, M10 = most active 10 hours of the day, MCB metabolic challenge breakfast, OGTT Oral Glucose Tolerance Test, iAUC incremental area under the curve. Source data are provided as a Source Data file.
