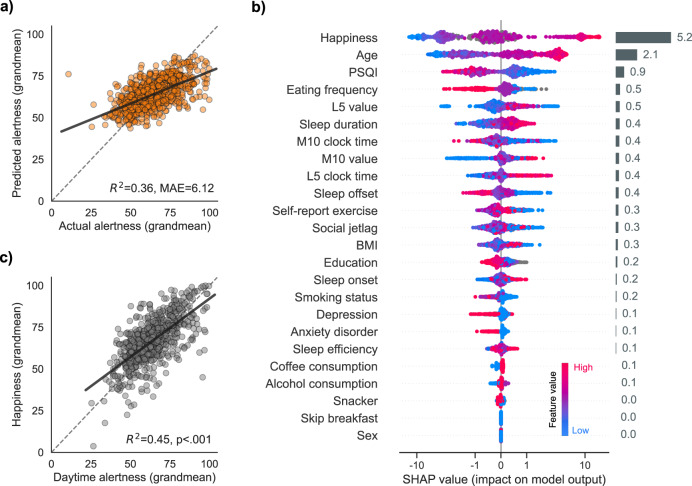
Fig. 5. Predictors of trait alertness.
a Cross-validated performance of the gradient boosting algorithm. Predictions of the trait alertness are plotted against the ground-truth values. Each dot represents an individual’s predicted and actual trait alertness. Trait alertness was calculated by averaging, for each individual, all their alertness rating across the two weeks of the study. b Features of the gradient boosting algorithm, ranked by order of descending importance. Features importance was calculated using the SHAP method (see “Methods”). Each dot on the plot is a Shapley value for a given predictor and participant. Shapley values represent, for each participant, the exact contribution of a given feature on the output of the model. The colour of the dots represents the value of a given predictor from low to high (e.g. for age, younger = blue, older = pink). Global feature importance is shown in the rightmost horizontal grey bars and was calculated by averaging the absolute Shapley values of a given predictor across all participants. c Trait correlation between happiness and alertness. Happiness was the most important feature of the model. Higher trait happiness is associated with higher trait alertness. Source data are provided as a Source Data file.

