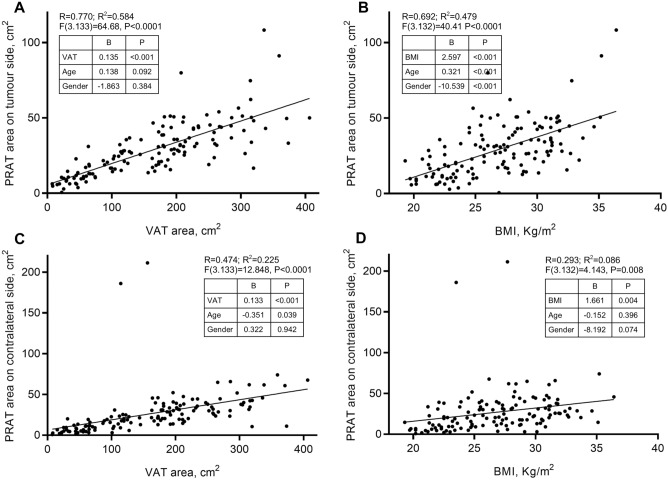
Figure 1.
Association of overall adiposity measures with perirenal adipose tissue areas. Linear regression with adjustment for age and gender, was used to calculate R and R2 between either VAT or BMI and tumour-sided and contralateral PRAT. Association between PRATt area with VAT (A) and BMI (B), and between PRATcl area with VAT (C) and BMI (D). VAT, visceral adipose tissue; PRAT, perirenal adipose tissue; BMI, body mass index. B, B-coefficient from linear regression analysis; P, P-value.

