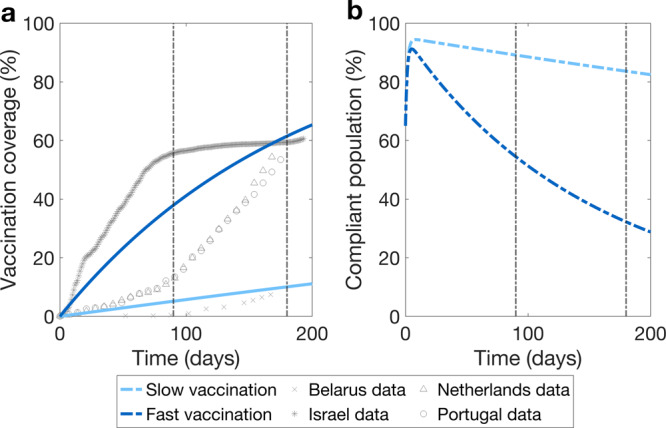
Fig. 2. Vaccination coverage and proportion of compliant population during the vaccination rollout.

a Increase in vaccination coverage for slow (light blue line) and fast (dark blue line) vaccination rates. Light grey markers show vaccination coverage for Belarus (crosses), Israel (stars), Netherlands (triangles), and Portugal (circles), respectively42.Smooth lines are output curves of the model indicating the proportion of the total population vaccinated if the whole population was eligible for vaccination and was vaccinated at a rate calculated using these data points. b Decrease in the proportion of who complies with physical distancing measures for slow and fast vaccination and a fixed incidence of infection (16,062 cases per day) observed in the Netherlands in the period used for the model calibration. Vertical brown lines mark three and six months since the start of vaccination.
