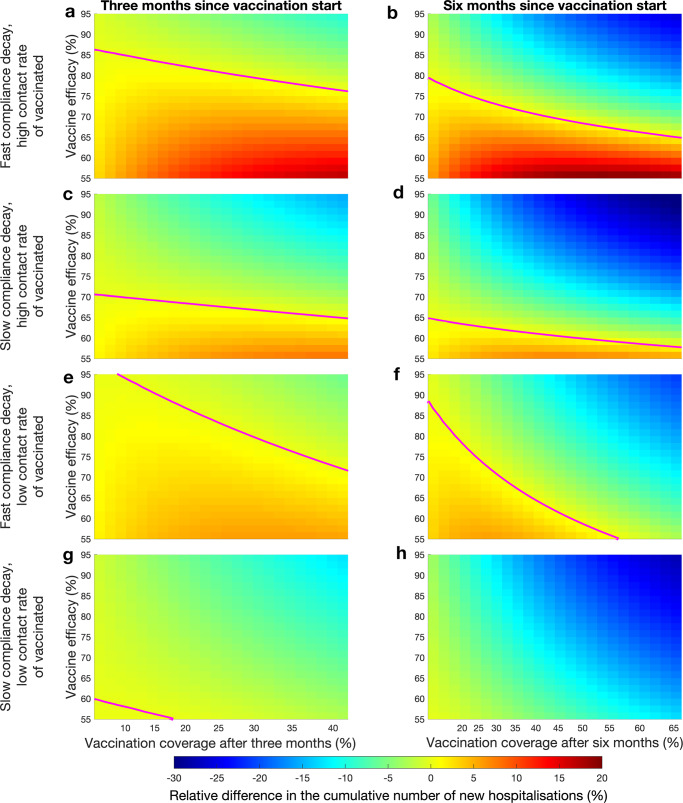
Fig. 6. Epidemic dynamics with and without interventions targeting compliance of vaccinated and non-vaccinated individuals.
The original variant of the virus circulates. All panels show relative difference in the cumulative number of new hospitalisations as compared to the no-vaccination scenario. a, b Vaccination rollout not supplemented with compliance interventions three and 6 months into the vaccination rollout, respectively. c, d Vaccination rollout supplemented with compliance interventions targeting non-vaccinated individuals three and 6 months into the vaccination rollout, respectively. e, f Vaccination rollout supplemented with compliance interventions targeting vaccinated individuals three and 6 months into the vaccination rollout, respectively. g, h Vaccination rollout supplemented with compliance interventions targeting both vaccinated and non-vaccinated individuals three and 6 months into the vaccination rollout, respectively. Magenta curves mark boundaries between parameter regions with different sign of the cumulative number of new hospitalisations. The scale of x-axis is not linear since the axes were obtained by conversion of the vaccine uptake rate to the vaccination coverage following three and six months after the start of the vaccination rollout.

