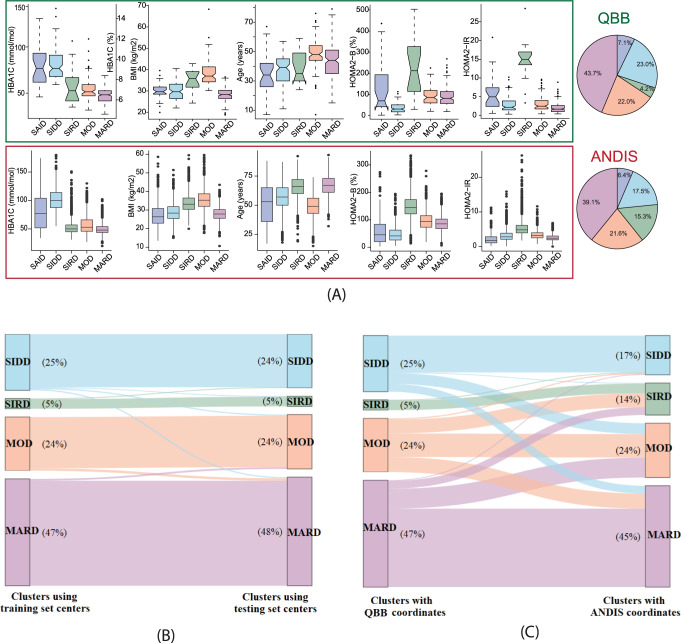
Fig. 2. Cluster characteristics and cluster distribution in QBB.
K-means clusters were derived using the QBB training set and classification was applied to the testing set using the training set cluster coordinates. A Distributions of HbA1c, BMI, age, HOMA2-B, and HOMA2-IR are shown for each cluster in QBB (N = 420 individuals) and ANDIS (N = 8980 individuals). HbA1c, BMI, HOMA2-B, and HOMA2-IR all followed the same trend in QBB and ANDIS, but individuals in the MOD cluster were younger than the other clusters in QBB. Data in boxplots are presented as follows: lower and upper whiskers represent the minima and maxima respectively, box centers represent the median values, bounds of boxes represent the first and third quartiles, notches represent the 95% confidence interval of the median, and circles represent outliers. B The testing set clusters were similar to the training set clusters, regardless of whether they were assigned based on the training set coordinate centers or derived de novo for the testing set using K-means clustering. Minor changes in the cluster assignments (2%) were observed when clustering the data using the training set coordinates versus the testing set coordinates. C The ANDIS coordinates were used instead of the QBB coordinates to classify QBB patients. Gender-specific type 2 diabetes cluster centers (SIDD, SIRD, MOD, and MARD) from Ahlqvist et al.8 were obtained. After computing the Euclidean distance between the four clusters and each individual in QBB, each individual was assigned to the cluster with the shortest distance. When comparing the cluster assignment that was based on the QBB coordinates vs. ANDIS coordinates, a 35% change in the cluster assignments was observed. QBB: Qatar Biobank, ANDIS: All New Diabetics in Scania, SAID: severe autoimmune diabetes, SIDD: Severe Insulin Deficient Diabetes, SIRD: Severe Insulin Resistant Diabetes, MOD: Mild Obesity-related Diabetes, MARD: Mild Age-related Diabetes.

