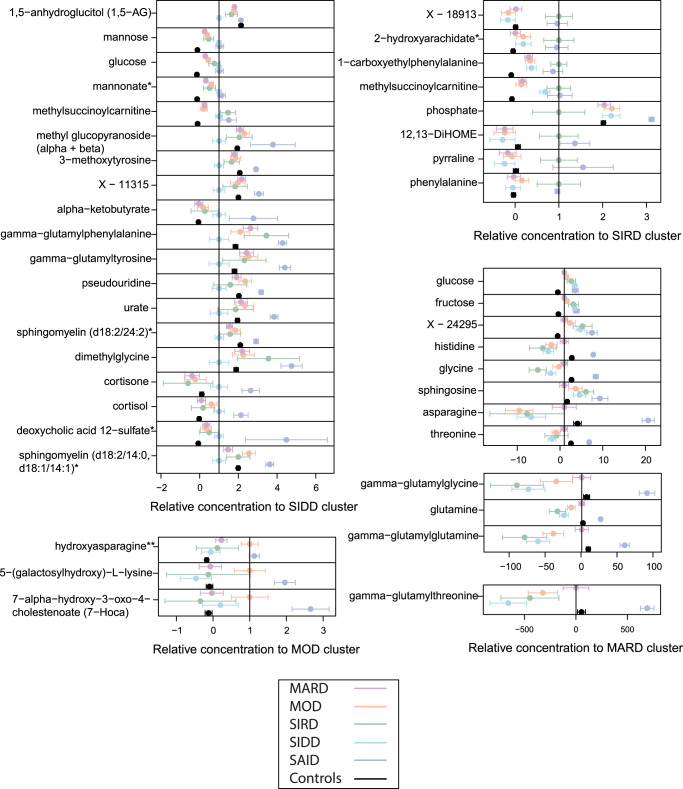
Fig. 5. Metabolites that distinguish individual diabetes subtypes (N = 420 individuals).
The dots and bars represent the mean metabolite values and the 95% confidence intervals of the means for metabolites that are different in one of the four T2D subtypes compared to all others. Values are normalized by the mean of the respective reference cluster. In addition, SAID and the control group is shown for reference. T2D type 2 diabetes, SAID severe autoimmune diabetes, SIDD severe insulin-deficient diabetes, SIRD severe insulin resistant diabetes, MOD mild obesity-related diabetes, MARD mild age-related diabetes.

