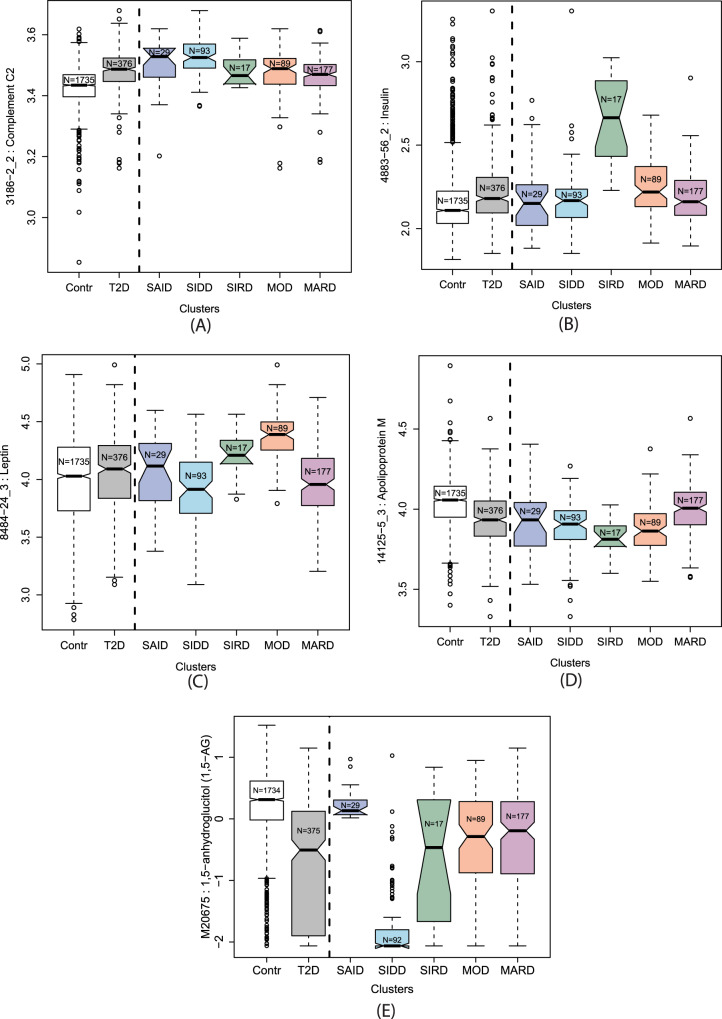
Fig. 6. Boxplots of the significantly altered proteins or metabolites in specific diabetes subtypes.
A Complement C2 (C2), B insulin (INS), C leptin (LEP), and D Apolipoprotein M (APOM) are significantly higher in SIDD, SIRD, MOD, and MARD, respectively, while E 1,5-AG is significantly lower in SIDD. The complete set of boxplots for all protein and metabolite levels for each cluster are in Supplementary Data 1 and Supplementary Data 2. Contr Controls, T2D type 2 diabetes, SAID severe autoimmune diabetes, SIDD severe insulin-deficient diabetes, SIRD severe insulin-resistant diabetes, MOD mild obesity-related diabetes, MARD mild age-related diabetes. Data in boxplots are presented as follows: lower and upper whiskers represent the minima and maxima respectively, box centers represent the median values, bounds of boxes represent the first and third quartiles, notches represent the 95% confidence interval of the median, and circles represent outliers.

