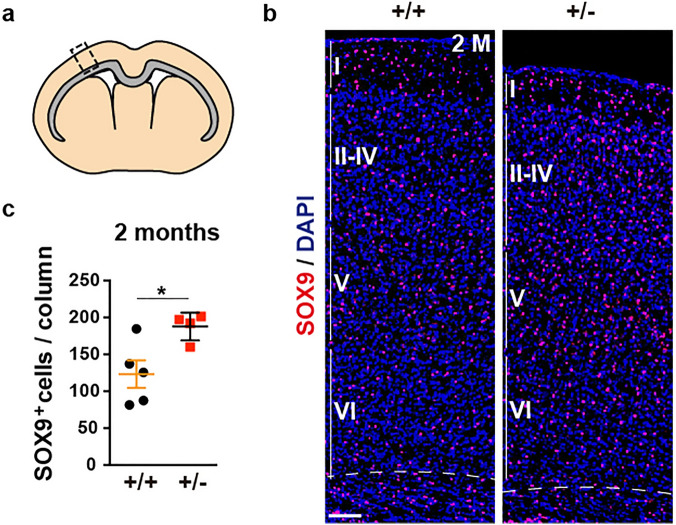
Figure 2.
Increased numbers of astrocytes in the neocortex of adult Dyrk1a+/− mice. (a) Schematic representation of a coronal brain section indicating the corpus callosum in grey and the region of the cerebral cortex for cell quantification (rectangle). (b) Brain sections from 2-month-old (2 M) Dyrk1a+/+ (+/+) and Dyrk1a+/− (+/−) mice stained for SOX9 and with the nuclei labelled by DAPI (blue). The position of the neocortical layers I to VI are indicated. (c) The number of SOX9+ astrocytes (mean ± SEM) in 500 μm wide columns. The values correspond to individual animals obtained from 2 litters: *P < 0.05, Student’s t-test. Scale bar: 100 μm.

