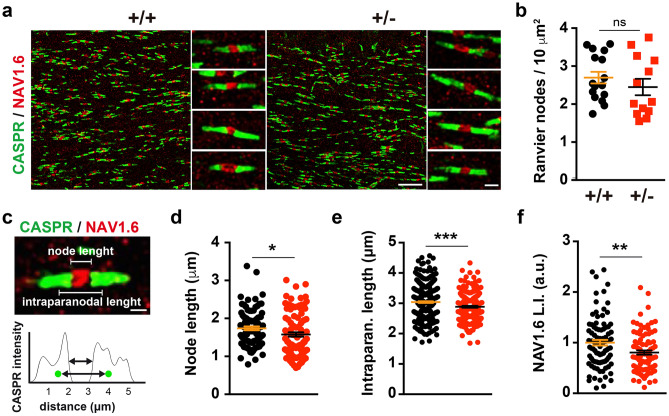
Figure 6.
Alterations to the nodes of Ranvier in adult Dyrk1a+/− mice. (a) Representative images from the corpus callosum of 2-month-old Dyrk1a+/+ (+/+) and Dyrk1a+/− (+ /−) mice showing the nodes of Ranvier labelled for NAV1.6 (red) and the paranodes for CASPR (green). (b) Density (mean ± SEM) of the nodes of Ranvier. The values correspond to the node density obtained from 16 (+/+) and 13 (+/−) images: ns, not significant, Student’s t-test. (c) Image showing a node of Ranvier and the intensity of CASPR staining in the paranodes. Green dots in the intensity profile represent the center of mass for each paranode as determined by the 3D object reconstruction. (d–f) Scatter dot plots showing the node length (d), intraparanodal length (e) and NAV1.6 labelling index (L.I.) (f) for individual nodes of Ranvier (n = 2–3 animals each genotype, 1 litter): 95 (+/+) and 100 (+/−) nodes in d; 356 (+/+) and 217 (+/−) in (e); 88 (+/+) and 90 (+/−) in (f); *P < 0.05 and **P < 0.01, Mann–Whitney U test; **P < 0.001, Student’s t-test.

