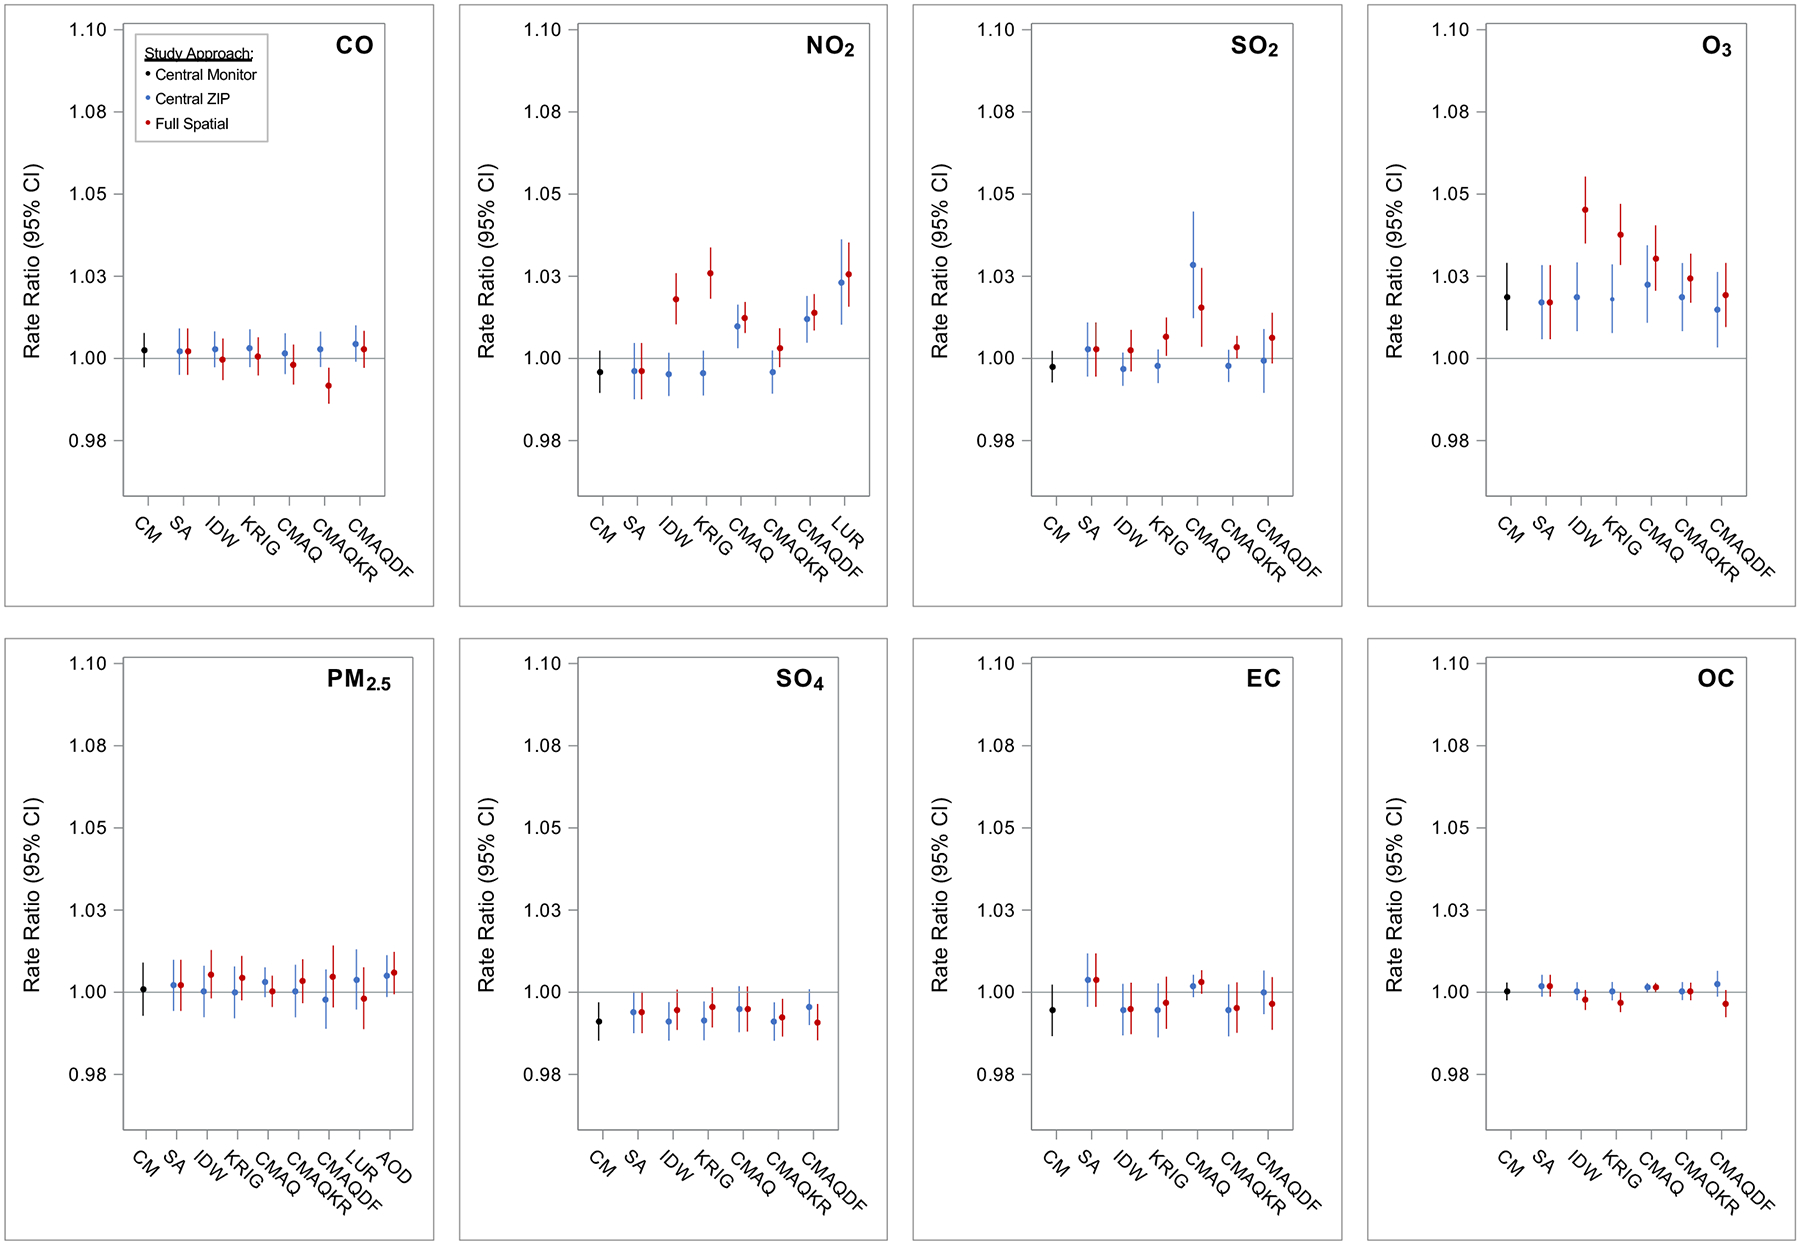
Figure 3. Associations of air pollution and ED visits for respiratory diseases, comparing among pollutants, exposure metrics, and study approaches.

Exposure metrics included: Central Monitor (CM), Site Average (SA), Inverse Distance Weighting (IDW), Kriging (KRIG), Community Multiscale Air Quality model (CMAQ), CMAQ-kriging adjustment with observations (CMAQKR), CMAQ combined with monitoring data in a data fusion (CMAQDF), Land Use Regression (LUR), and satellite Aerosol Optical Depth (AOD). Study approaches included assigning: Central Monitor values to all 192 ZIP codes by day (black), Central ZIP Code values for each exposure metric to all 192 ZIP codes by day (blue), and the Full Spatial information of the exposure metrics to the 192 ZIP codes by day (red). All models controlled for time and meteorology as specified by the base model. Rate ratios (RR) and confidence intervals (CI) scaled to standard units: per 250 ppb CO, 10 ppb NO2, 4 ppb SO2, 15 ppb O3, 5 μg/m3 PM2.5, 1 μg/m3 SO42−, 0.5 μg/m3 EC, and 1 μg/m3 OC.
