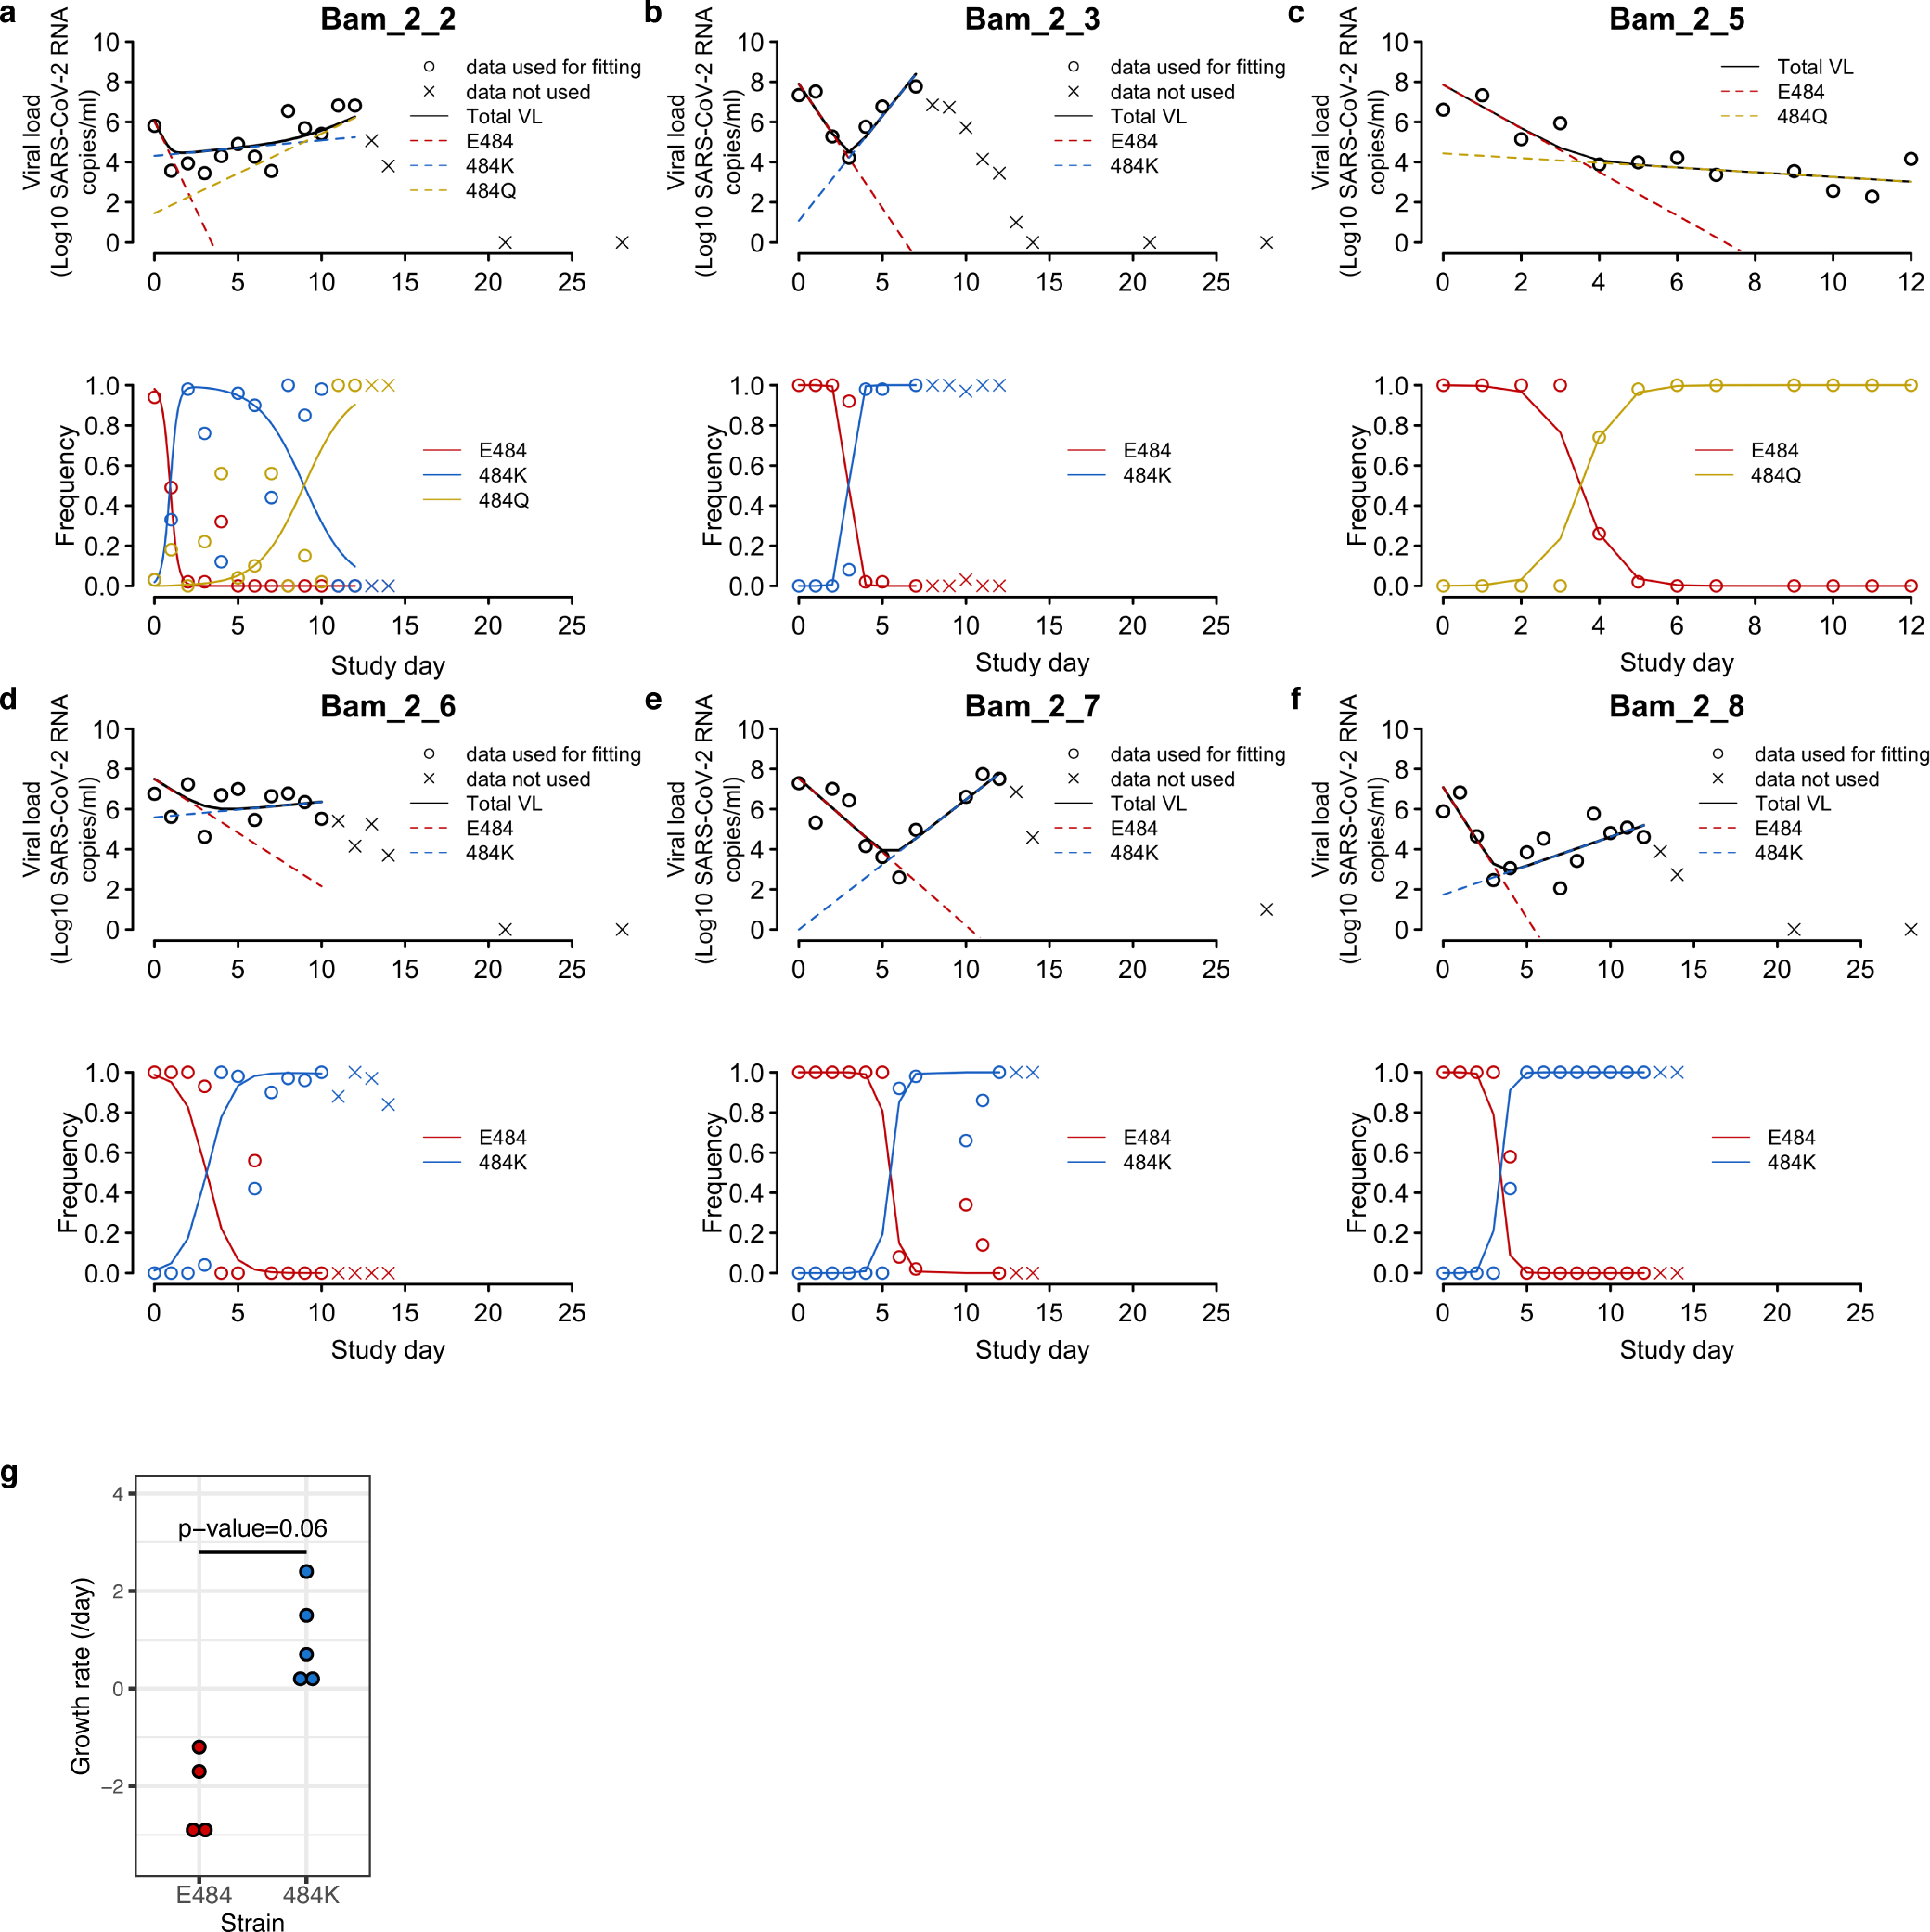
Extended data Figure 3: Fitting of the mathematical model to viral load and viral frequency data in individuals with resistance mutations.

(A-F) In each panel, the upper plot shows the viral load kinetics in the individual with the ID shown in the title; the lower plot shows the frequencies over time for the mutants under analysis. Data used for model fitting are shown as ‘o’ and data not used for model fitting are shown as ‘x’. Simulation results using the best-fit parameters (Supplemental Table 2) are shown as lines. (G) Comparison of growth rates of the E484 and the 484K strains estimated from mathematical models for 5 individuals. P-value is calculated using a Wilcoxon signed rank test for paired data.
