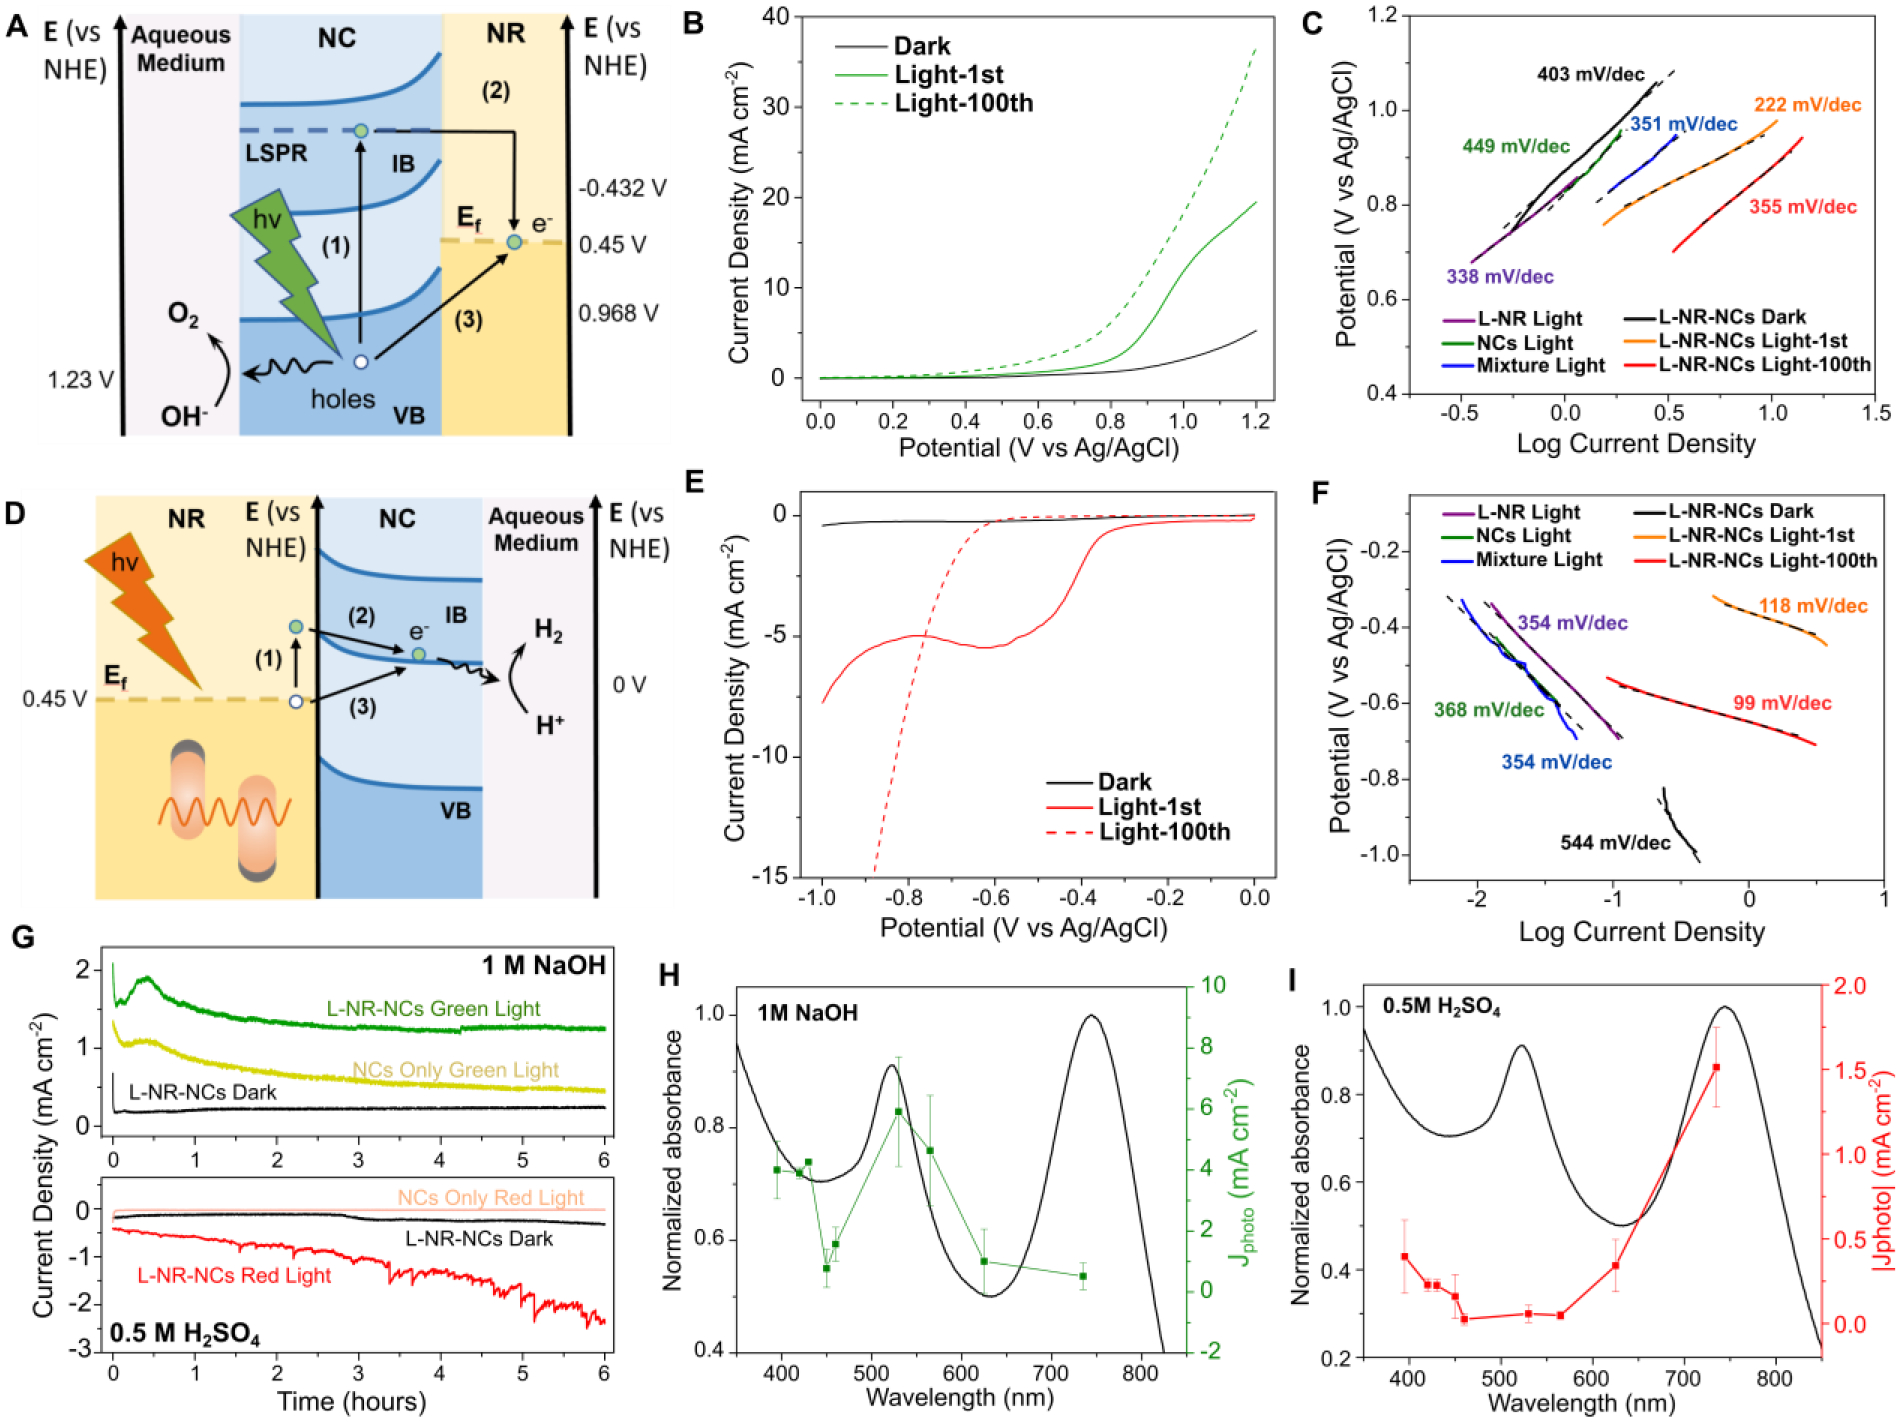
Figure 2. Photoelectrochemical Characterizations of the Hybrid Plasmonic Photocatalyst.

(A-C) Plasmonic charge transfer scheme (A), LSV curves (B), and Tafel Plot (C) for OER photocatalysis in 1 M NaOH by L-NR-NCs with green light irradiation from a 530 nm LED. Processes (1) and (2) describes an indirect hot charge carrier transfer pathway, whereas (3) describes a direct plasmonic charge carrier transfer in (A).
(D-F) Plasmonic charge transfer scheme (D), LSV curves (E), and Tafel plot (F) for HER photocatalysis in 0.5 M H2SO4 by L-NR-NCs with red light irradiation from a 730 nm LED. Processes (1) and (2) describes an indirect hot charge carrier transfer pathway, whereas (3) describes a direct plasmonic charge carrier transfer in (D).
(G) Chronoamperometry (CA) curves of L-NR-NCs or NCs only control in 1M NaOH with 0.8 V (vs. Ag/AgCl) applied bias (top), or in 0.5 M H2SO4 with −0.7 V applied bias (bottom), with or without light.
(H, I) Wavelength dependence of L-NR-NCs catalytic Jphoto in 1 M NaOH at 0.8 V applied bias (H), or 0.5 M H2SO4 at −0.7 V applied bias (I). Black curves: absorbance spectra of L-NR-NCs water suspension; green/red curves: Jphoto at different excitation wavelengths after 100 scans of activation. Error bars: Mean ± standard deviation of 3 independent measurements.
