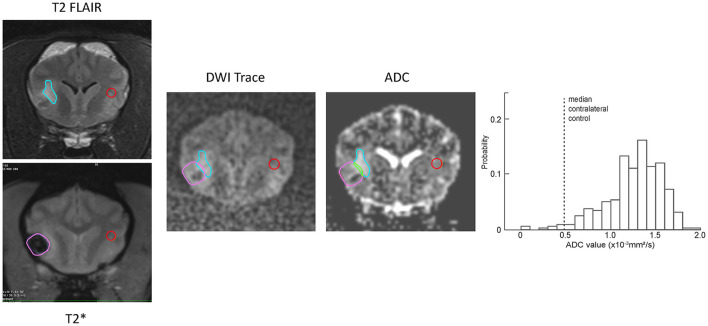
Figure 5.
Examples of ROI (blue outline) and contralateral normal control (red outline) region selection for a representative example hemorrhagic CVA. The regions were selected on the T2-FLAIR transverse images and copied to the DWI and ADC series. The region of T2* hypointensity was defined on the corresponding T2* transverse image (lavender outline). Pixels that were within both the T2-FLAIR hyperintense region and the T2* hypointense region (green outline) were excluded from the resulting probability histogram (right). The histogram shows the ADC values of non-excluded pixels within the ROI, as well as the median ADC value within the contralateral control region (dotted line).

