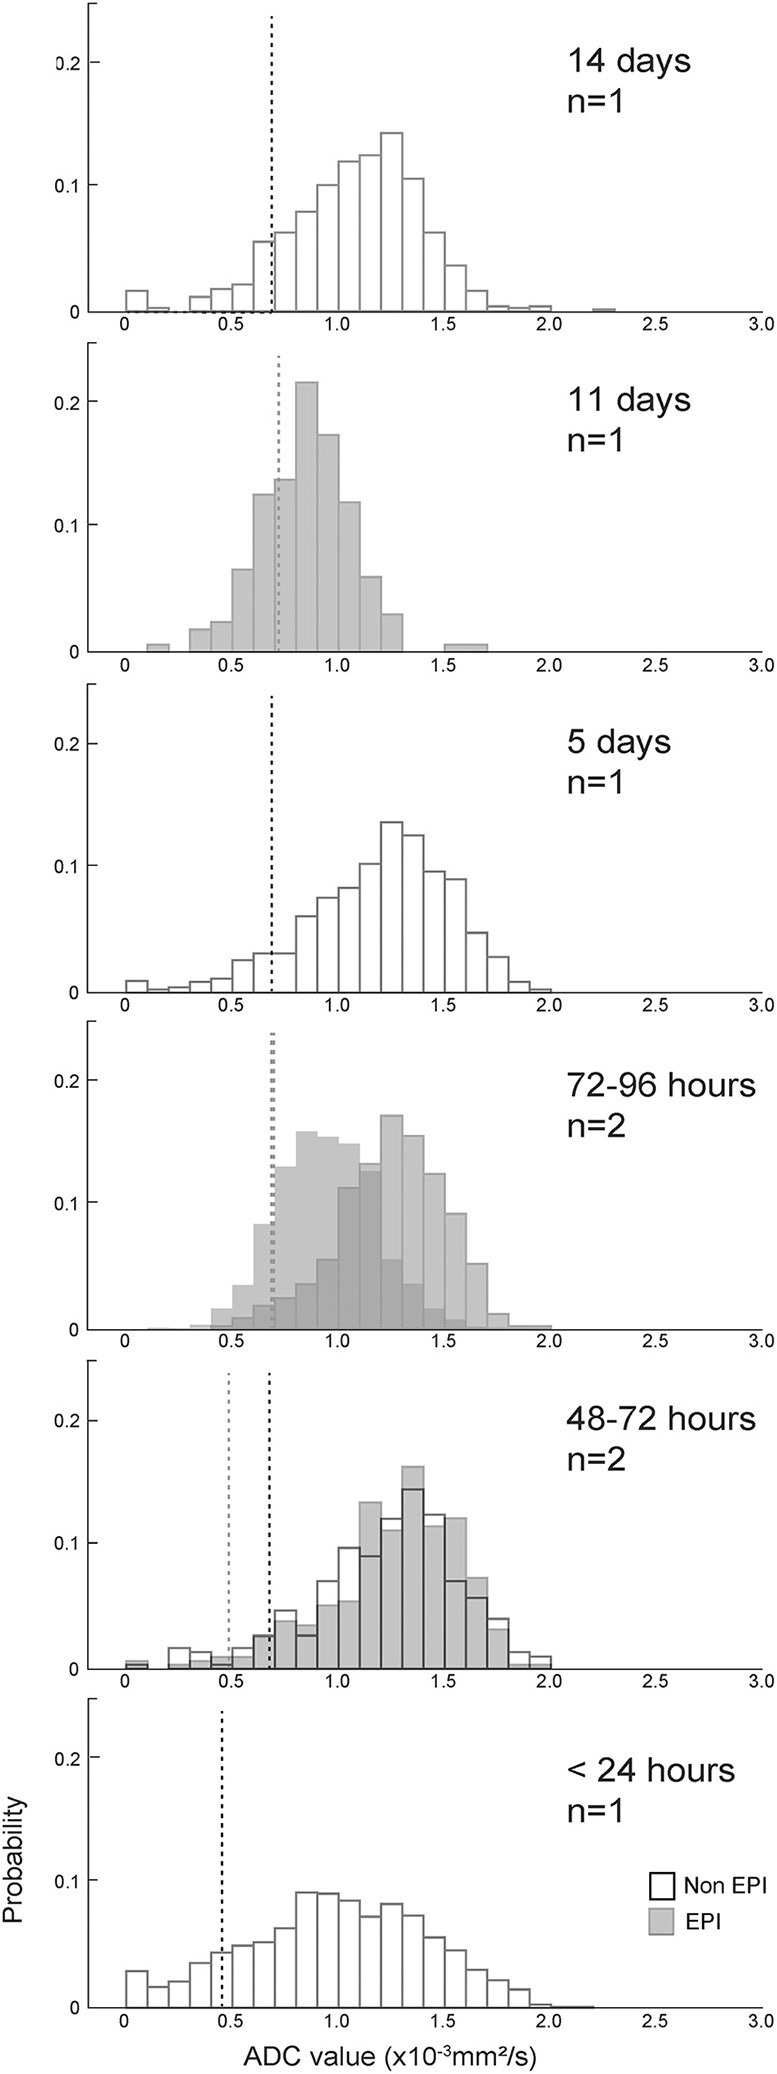
Figure 6.

ADC value histograms for the T2-FLAIR hyperintense region adjacent to eight hemorrhagic CVAs, arranged by duration of clinical signs (more recent events below older events). Black outline bars indicate non-EPI DWI, and gray bars indicate EPI DWI. The dotted lines show median ADC values for the control regions for each histogram, with black dotted lines corresponding to non-EPI DWI, and gray dotted lines corresponding to EPI DWI. Median absolute and relative ADC values for the T2-FLAIR ROIs, median absolute ADC values for the contralateral control regions, and anatomical locations of the lesions/control selections are listed in Table 1. There was no evidence of restricted diffusion adjacent to the T2* hypointense region in any dog.
