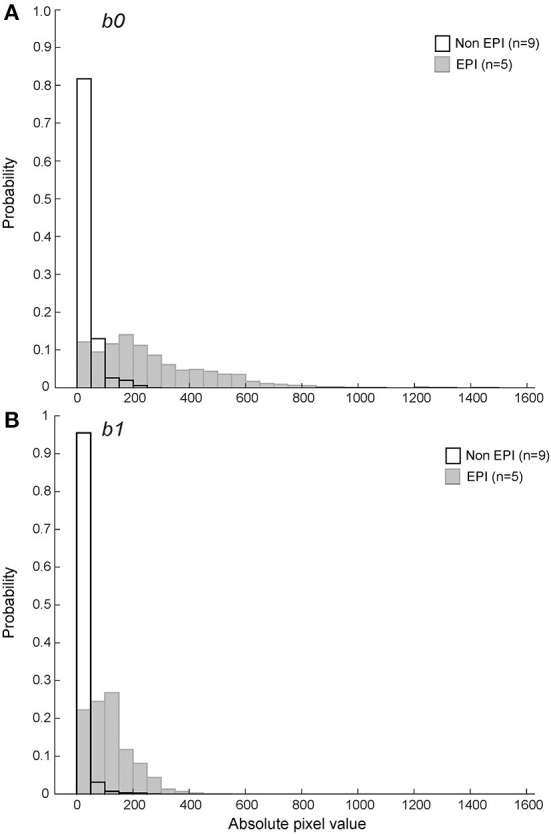
Figure 7.

Probability histograms of pixel values within the T2* hypointense ROIs for b0 (A) and b1 (B) DWI series (see text for variable definitions). Non-EPI series used b1 = 800s/mm2 and are shown in black outline. The pixel values within ROIs defined by the T2* hypointense region were more likely to be zero or close to zero on non-EPI ADC series for both b0 and b1.
