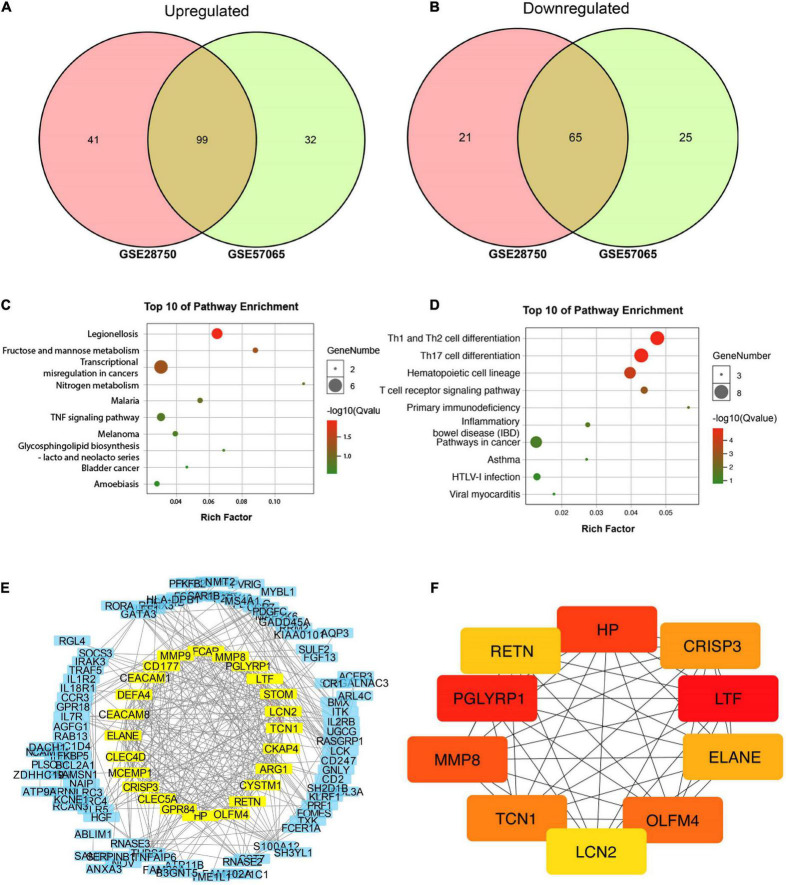
FIGURE 2.
Bioinformatic identification based on gene expression omnibus (GEO) database. (A,B) Venn diagram of 99 common upregulated and 65 common downregulated DEGs. (C) Top 10 pathways enriched by GO. (D) Top 10 pathways enriched by KEGG. (E) Protein-protein interaction (PPI) network for discovering hub genes. (F) Top 10 molecules in network string interactions ranked by maximal clique centrality (MCC) method.

