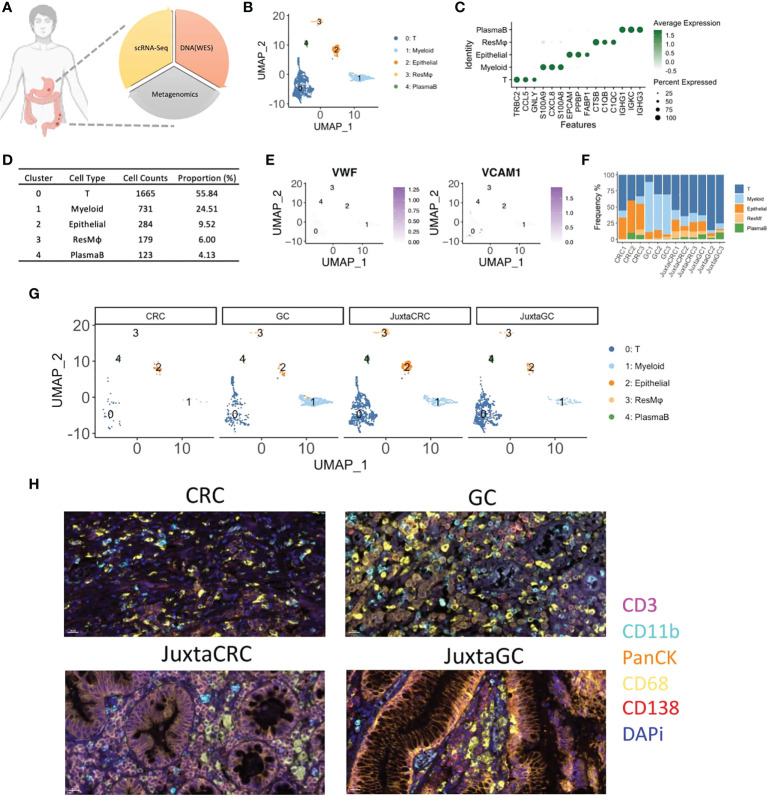
Figure 1.
The overview of scRNA-seq profiles of CRC and GC. (A) The schematic of experimental design in this study. ScRNA-seq, WES, and OTU investigated the primal malignancy sites’ transcriptomics, genomics, and metagenomics profile. (B) UMAP plot of scRNA-seq data identified five cell populations, including T cells, myeloid cells, epithelial cells, residential macrophages (ResMφ), and plasma B cells. (C) Dot plot showed the top 3 cluster-specific feature genes, dot size indicated the percent expressed, and the level of color indicated the average expression. (D) The distribution frequency and proportion of each cell population. (E) Feature plots showed the expression pattern of the diagnostic marker genes for endothelial cells, including VWF and VCAM1. (F) Bar plot displayed the proportion of each cell population across samples. (G) UMAP plots of scRNA-seq data spat by samples. (H) mIHC staining of CD3 (magenta), CD11b (cyan), PanCK (orange), CD68 (yellow), CD138 (red), and DAPi (blue) in CRC, GC, JuxtaCRC, and JuxtaGC sites.

