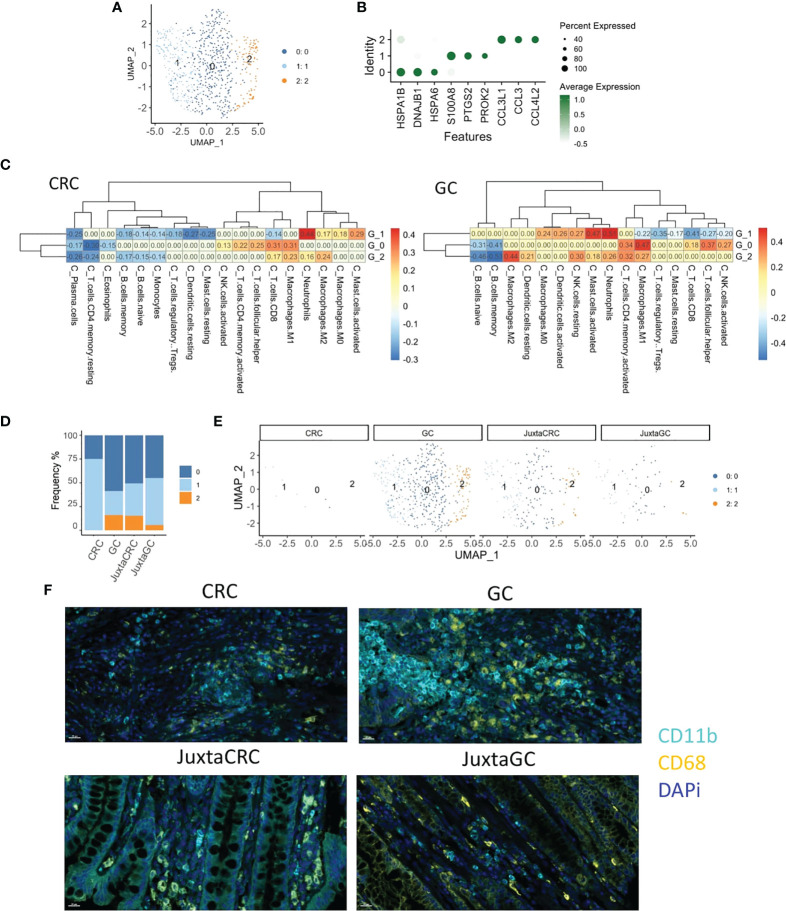
Figure 3.
Myeloid cell enrichment in the GC site. (A) UMAP plots of the myeloid cell population reveal three cell subsets, namely, clusters 0, 1, and 2. (B) Dot plot shows the top three cluster-specific feature genes, dot size indicates the percent expressed, and the level of color indicates the average expression. (C) Heatmaps show the correlation relationship between subset GSVA score and the fraction of 22 subpopulations of immune cells of CRC and GC, respectively, generated by CIBERSORT (left: CRC, right: GC). (D) Bar plot displays the population of each myeloid cell subset across samples. (E) UMAP plots of the myeloid cell population spat by samples. (F) mIHC staining of CD11b (cyan), CD68 (yellow), and DAPi (blue) in CRC, GC, JuxtaCRC, and JuxtaGC sites.

