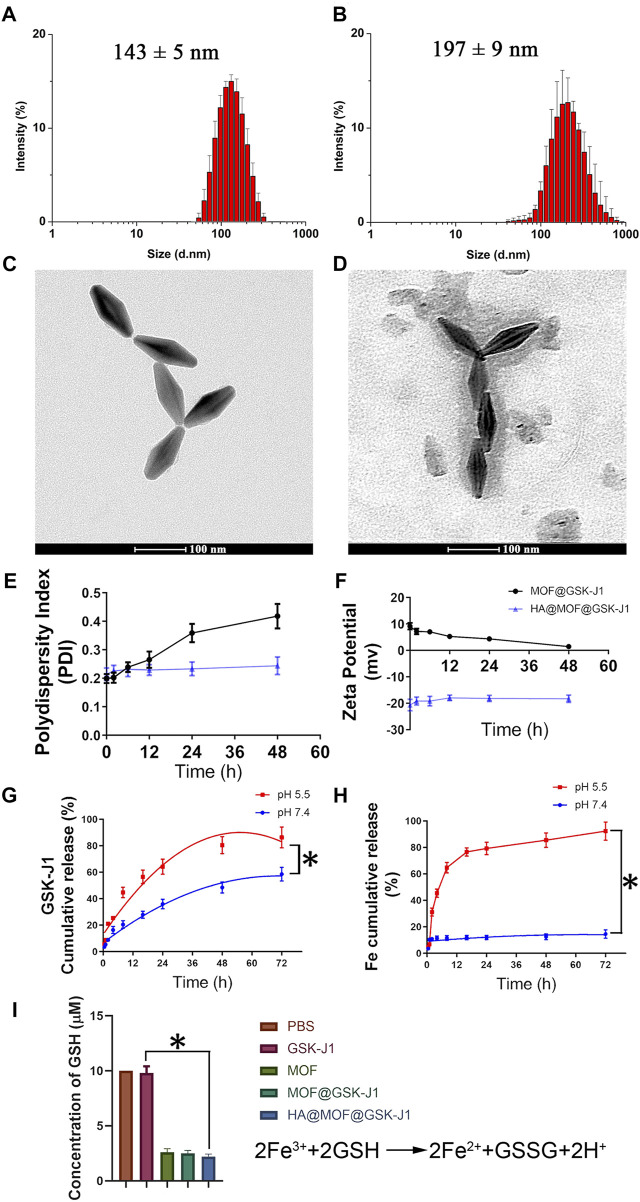
FIGURE 1.
Size distributions of (A) MOF@GSK-J1 and (B) HA@MOF@GSK-J1 based on DLS. Transmission electron micrographs of (C) MOF@GSK-J1 NPs and (D) HA@MOF@GSK-J1 NPs. Scale bar: 100 nm. (E) Polydispersity index and (F) zeta potential of MOF@GSK-J1 and HA@MOF@GSK-J1 NPs after incubation in RPMI 1640 containing 10% FBS at 37°C for 48 h. (G) Accumulative release of MOF@GSK-J1 and HA@MOF@GSK-J1 NPs after incubation in pH 5.5 and pH 7.4 PBS at 37°C for 72 h. (H) Accumulative release of Fe3+ after incubation in pH 5.5 and pH 7.4 PBS at 37°C for 72 h (I) GSH concentrations after incubation in different formulations of pH 5.5 PBS at 37°C for 24 h. The results are expressed as mean ± SD, n = 3; *, p < 0.05.

