FIGURE 3.

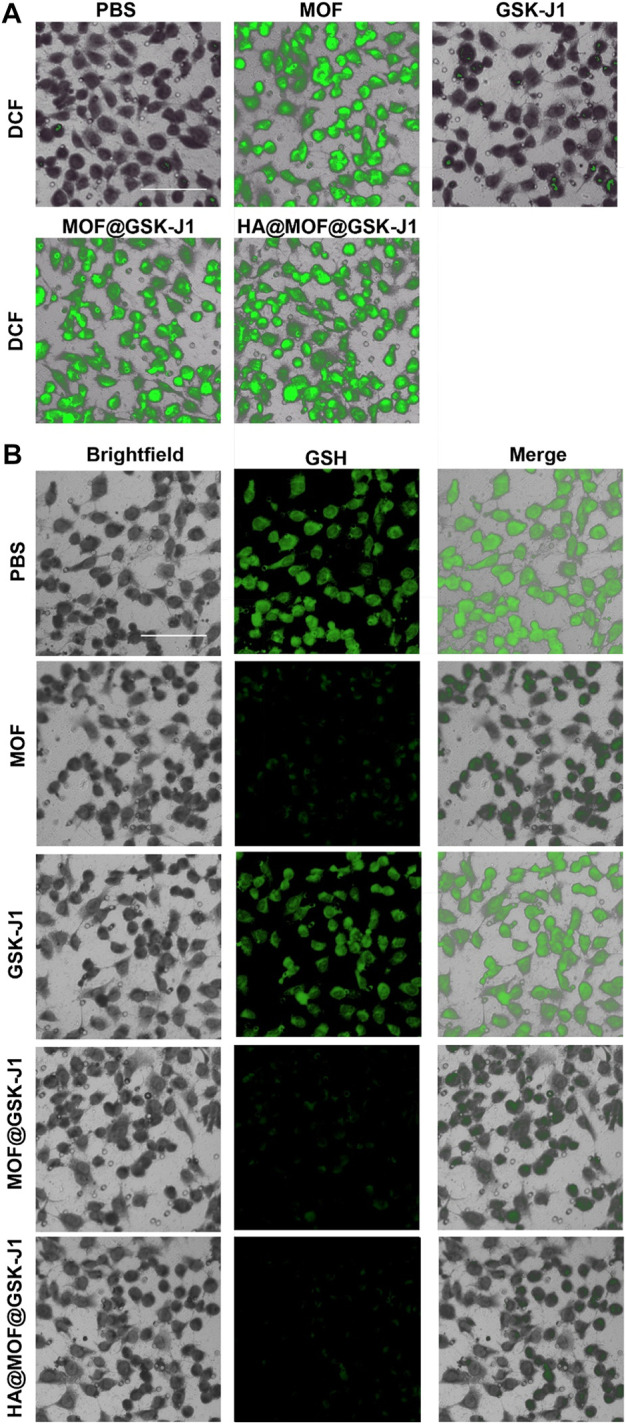
CLSM images of intracellular (A) ROS generation and (B) GSH consumption by PBS, MOF, GSK-J1, MOF@GSK-J1, and HA@MOF@GSK-J1. Scale bar: 100 μm.

CLSM images of intracellular (A) ROS generation and (B) GSH consumption by PBS, MOF, GSK-J1, MOF@GSK-J1, and HA@MOF@GSK-J1. Scale bar: 100 μm.