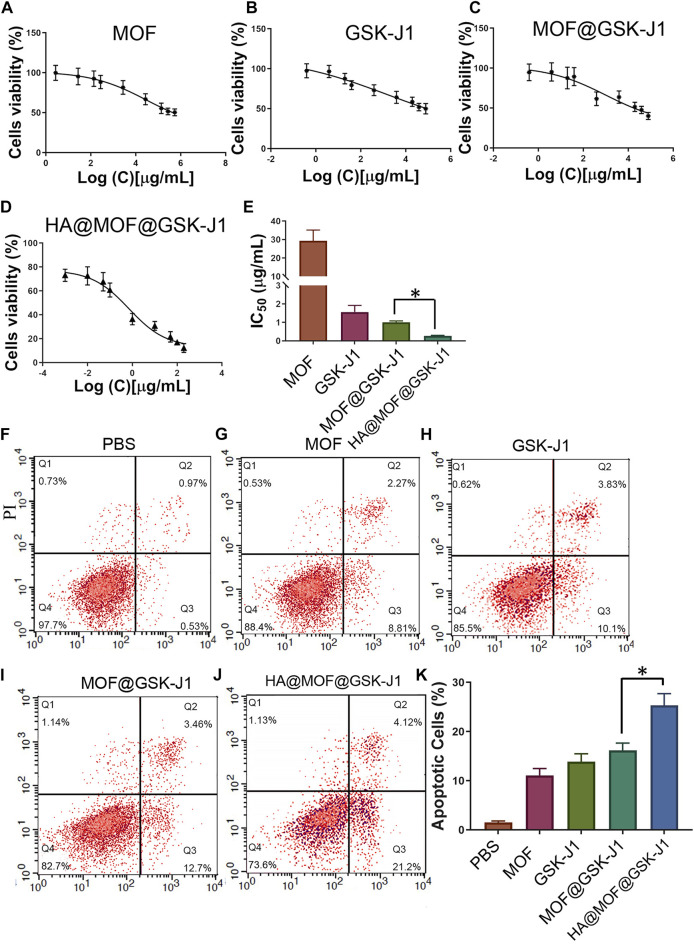
FIGURE 4.
(A–D) Cytotoxicities of CR SKOV-3 cells treated with various concentrations of MOF, GSK-J1, MOF@GSK-J1, and HA@MOF@GSK-J1. (E) Histogram of cytotoxicity after different treatments. (F–J) CR SKOV-3 cell apoptosis determined by flow cytometry after incubation with PBS, MOF, GSK-J1, MOF@GSK-J1, and HA@MOF@GSK-J1, respectively. (K) Histogram of CR SKOV-3 cell apoptosis after different treatments. n = 3, *, p < 0.05.

