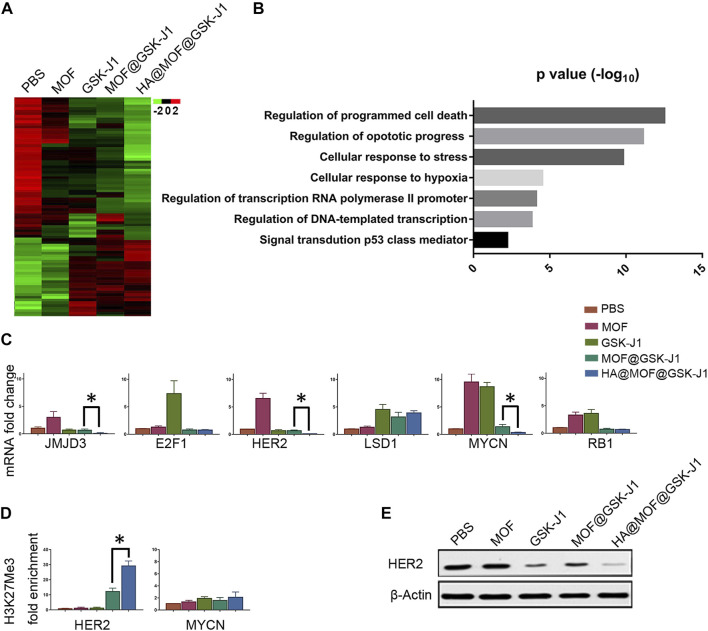
FIGURE 6.
HA@MOF@GSK-J1 affects a JMJD3-mediated gene network. (A) Heat-map of gene expression in CR SKOV-3 cells after different treatments (B) KEGG analysis of the biological pathways of the genes in regulated CR SKOV-3 cells following treatment with HA@MOF@GSK-J1 compared to treatment with MOF@GSK-J1 treated. (C) Histograms showing the RNA fold-induction of different treatments. qPCR analysis of CR SKOV-3 cells was performed using the indicated primers after different treatments (Supplementary Table S1). Amplification of GAPDH transcripts was used to normalize the loading of each RNA sample. (D) ChIP-qPCR analysis of H3K27me3 mark of the HER2, and MYCN promoters in CR SKOV-3 cells treated with different formulations. (E) Western blot analysis of HER2 in CR SKOV-3 cells after different treatments. All results are expressed as fold-inductions (means) from three independent experiments. The bars indicate SD (*p < 0.05, Student’s t-tests).

