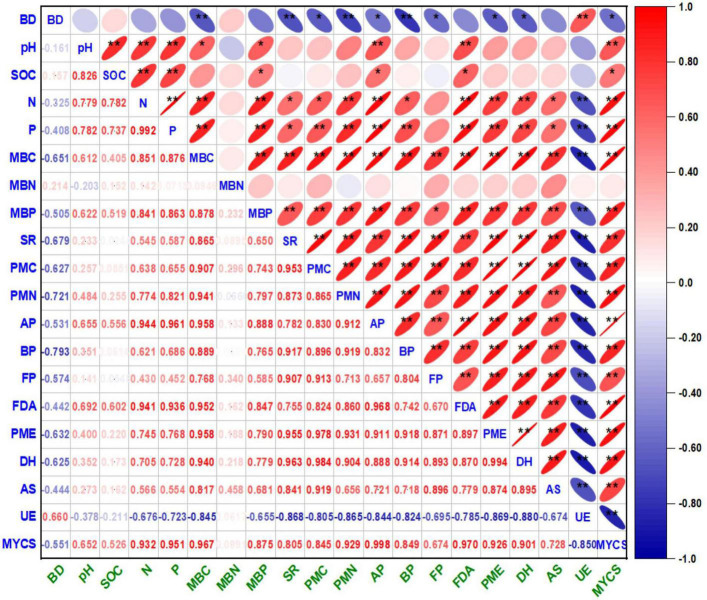
FIGURE 3.
Correlograms of Pearson correlation coefficients (r) matrix between the soil physico-chemical and biological entities under cauliflower–cowpea–okra cropping system. The correlation coefficient (r) values are significantly positive at p < 0.01 (**) and p < 0.05 (*) levels of probability (2-tailed); the color assigned to a point in the correlograms grid indicates the strength of a correlation between the soil biological entities, and r values correspond directly to the color codes ranging from red to blue, respectively. Right and left tilted ellipse in the correlograms grid indicate positive and negative correlation, respectively. where, Bd, bulk density; SOC, soil organic carbon; MBC, microbial biomass carbon; MINN, mineralizable nitrogen; AP, actinomycetes population; BP, bacterial population; FP, fungal population; AS, arylsulphatase activity; DHA, dehydrogenase activity; FDA, fluorescein di-acetate hydrolysis activity; PMA, phosphomonoesterase activity; UE, urease activity.

