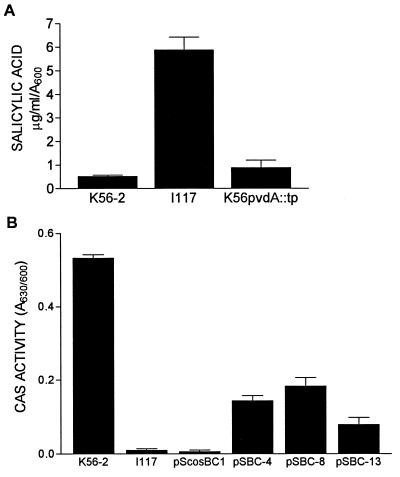
FIG. 4.
Siderophore production assays. (A) Comparison of SA production by K56-2, I117, and K56pvdA::tp. Values represent the means ± the standard deviations of triplicate assays. I117 significantly different than K56-2 and K56pvdA::tp (P < 0.001) by using analysis of variance (ANOVA). (B) Partial complementation of I117 CAS activity (ornibactin production) by cosmid clones pSBC-4, pSBC-8, and pSBC-13. Values represent the means ± the standard deviation of triplicate assays. CAS activity is per 10 μl of culture supernatant. K56-2, pSBC-4, pSBC-8, and pSBC-13 are significantly different than I117 or pScosBC1 (P < 0.001) by ANOVA.

