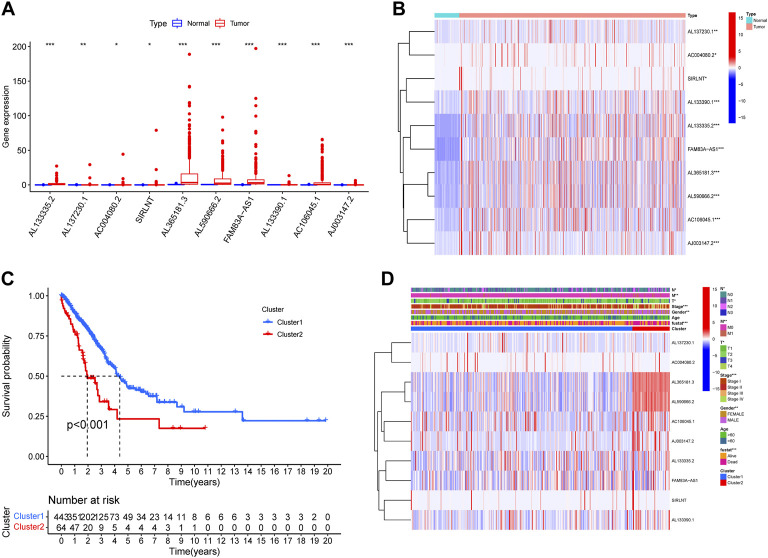
FIGURE 1.
Different prognosis and clinicopathological features of two LUAD clusters. Boxplot (A) and heatmap (B) revealed the difference in expression of 10 NETs-associated lncRNA in normal and tumor tissues (C) The overall survival rate of LUAD patients in the two clusters was calculated by Kaplan-Meier curve (D) Heatmap exhibited the differences in expression of 10 NETs-associated lncRNA and clinicopathological features of two LUAD clusters (*p < 0.05, ** p < 0.01, *** p < 0.001).

