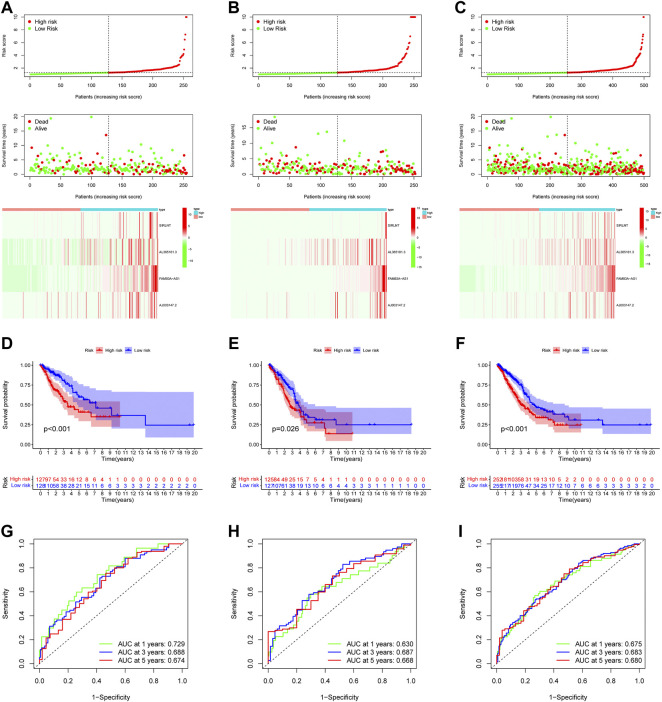
FIGURE 3.
Prognostic model construction and evaluation. In the training cohort (A), testing cohort (B) and entire cohort (C) the patient with different risk score, survival status, and NETs-associated lncRNAs expression were shown. Survival analysis of training cohort (D), testing cohort (E) and entire cohort (F) and the prognosis of high-risk group was significantly worse. ROC curve revealed that in the training cohort (G), testing cohort (H) and entire cohort (I), the AUC values for 1, 3, and 5-year OS were over 0.6.

