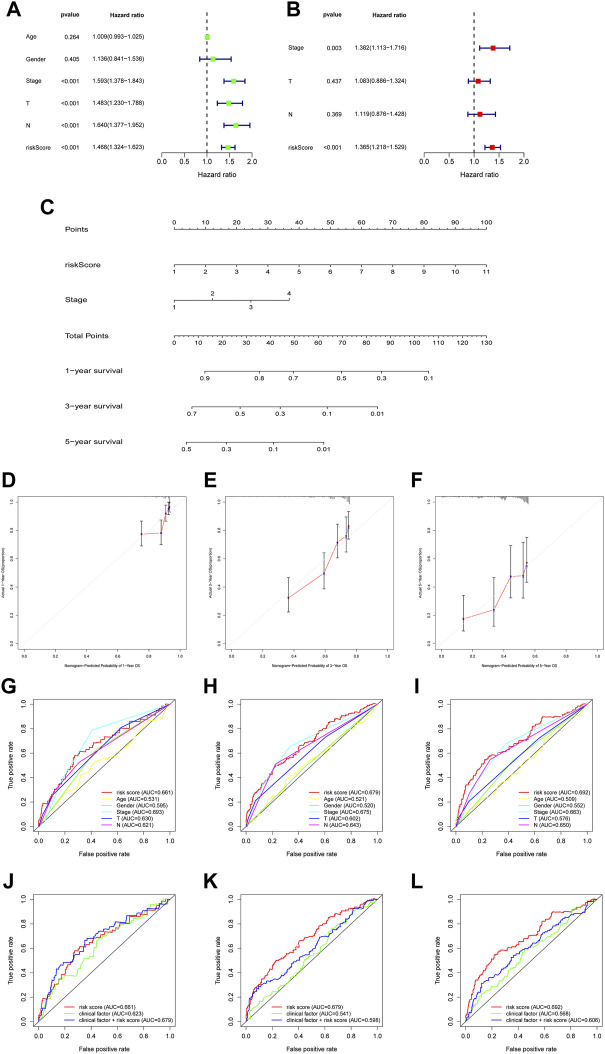
FIGURE 4.
The construction and assessment of prognostic nomogram. (A,B) Univariate and multivariate Cox regression analyses were used to evaluate whether risk score and clinical characteristics were independent predictors. (C) A nomogram was constructed to predict OS (D–F) The calibration curves of the nomogram based on 1-, 3-, and 5-year OS (G–I) The ROC curve of risk score and clinical characteristics was performed based on 1-, 3-, and 5-year OS (J–L) When combined risk score with clinical factors for analysis, the AUC values of 1-, 3-, and 5-year OS was detected.

