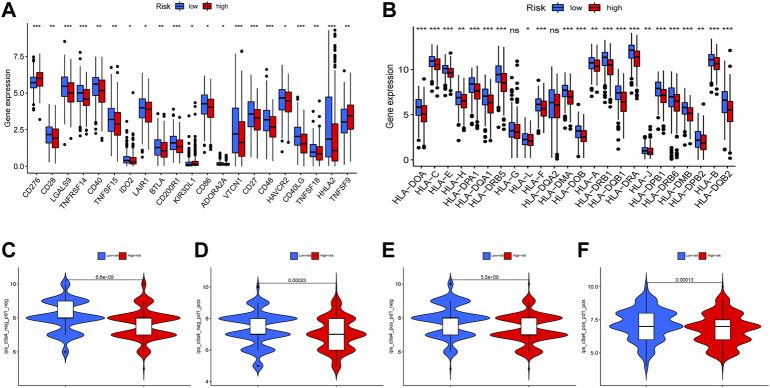
FIGURE 8.
The correlations between risk score and immune checkpoint, immunephenoscores (IPS). The difference of immune checkpoint related genes (A) a and HLA-related genes (B) were showed in boxplot between high-risk and low-risk groups. The differences of IPS in patients with different risk are shown (C–F) (ns, not significant, * p < 0.05, ** p < 0.01, *** p < 0.001).

