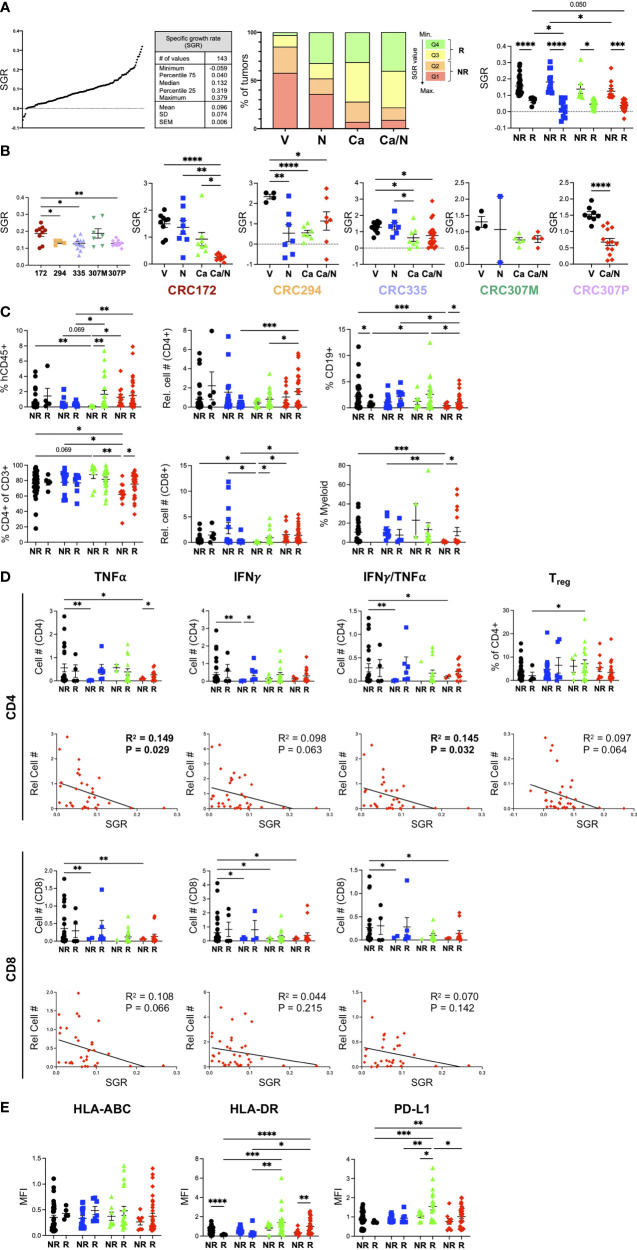
Figure 6.
Increased CD4+ TNFα+IFNγ+ signature correlates with smaller CRC MSS tumors from HIS-BRGS mice treated with Ca/N combination. (A) SGR were determined for each of 5 CRC PDX MSS tumors studied in HIS-BRGS mice: distribution of SGRs among all PDX tumors (left panel), frequencies of SGR according to quartiles (middle panel) and to responder (Q3+Q4) or non-responder (Q1+Q2) assignments (right panel) among four treatment cohorts. (B) Tumor growth, as measured by SGR, in untreated (left panel) and treatment responses (right panels) among 5 CRC MSS PDX studied in HIS-BRGS mice. (C) Human immune populations among non-responder and responder tumors from different treatment groups. (D) Number of TNFα+, IFNγ+ or IFNγ+TNFα+ cytotoxic CD4+ (upper panels) and CD8+(lower) panels in non-responder and responder (upper) and in correlation with the SGR (lower) of CRC MSS PDXs from HIS-BRGS mice in four treatment groups. SGR correlations are from combination treatment groups (red) only. (E) Expression, as indicated by MFI, of MHC Class I (HLA-ABC, left), MHC Class II (middle) and PD-L1 (right) on EpCAM+ MSS-CRC PDX explanted from HIS-BRGS mice by responder/non-responder tumor status and according to treatment groups. For all panels, colors indicate different treatment groups: (black- vehicle, blue-nivolumab, green-cabozantinib, red- combination). For column graphs, P-values indicate ANOVA multiple comparisons with Welch’s correction: *p < 0.05, **p < 0.01, ***p < 0.001, ****p < 0.0001. For SGR correlations, linear regression analysis was used to assess the correlation (R2) and significance, as indicated by p-value. Values in bold indicated statistical significance with a p < 0.05 cut-off.

