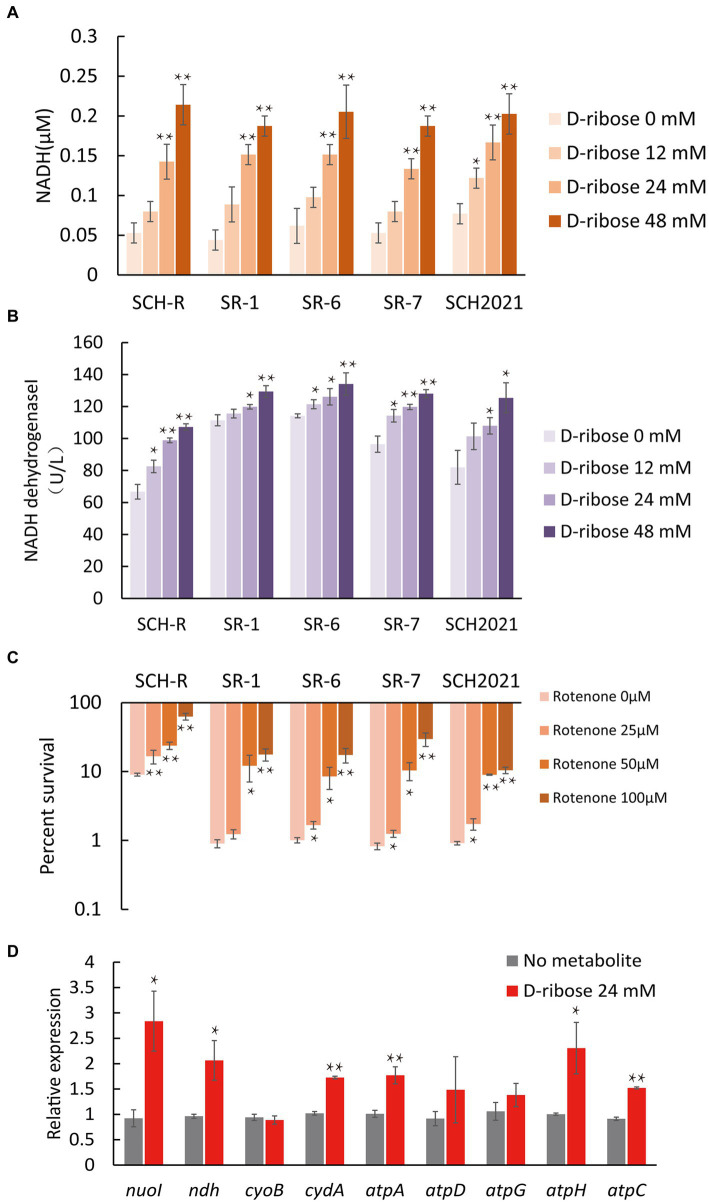
Figure 6.
Effect of exogenous D-ribose on the electron transport chain. (A) The intracellular NADH concentration of SCH-R and clinical isolates by D-ribose dose. (B) Activity of NADH dehydrogenase 1 in SCH-R and clinical isolates by D-ribose dose. (C) Percent survival of SCH-R and clinical isolates by rotenone dose and 1 MIC gentamicin plus 24 mM D-ribose. (D) QRT-PCR of key electron transport chain genes in the presence 24 mM D-ribose. nuoI, NADH dehydrogenase I chain I; ndh, NADH:quinone reductase; cyoB, cytochrome o ubiquinol oxidase subunit I; cydA, cytochrome BD2 subunit I; atpA, atpD, atpG, atpH and atpC, membrane-bound ATP synthase, F1 sector, alpha-subunit, beta-subunit, gamma-subunit, delta-subunit, and epsilon-subunit. Results are displayed as the mean ± SEM and three biological repeats are carried out. Significant differences are identified (*p < 0.05 and **p < 0.01).

