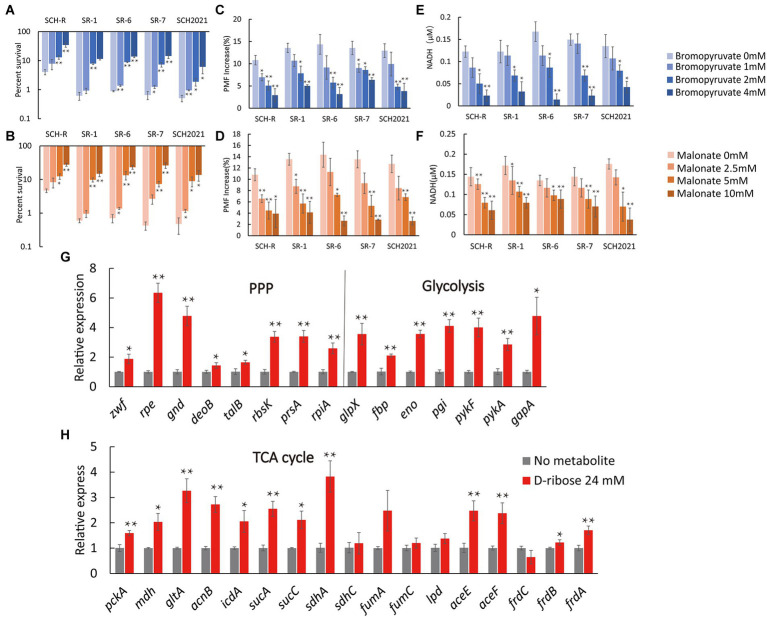
Figure 7.
Effect of exogenous D-ribose on central carbon metabolism. (A,B) Percent survival of SCH-R and clinical isolates by (A) bromopyruvate and (B) malonate dose and 1 MIC gentamicin plus 24 mM D-ribose. (C,D) PMF of SCH-R and clinical isolates by (C) bromopyruvate and (D) malonate dose with 24 mM D-ribose. (E,F) Intracellular NADH concentration of SCH-R and clinical isolates by (E) bromopyruvate and (F) malonate dose with 24 mM D-ribose. (G,H) QRT-PCR for expression of key central carbon metabolism genes in the presence of 24 mM D-ribose. Results are displayed as the mean ± SEM and three biological repeats are carried out. Significant differences are identified (*p < 0.05 and **p < 0.01).

