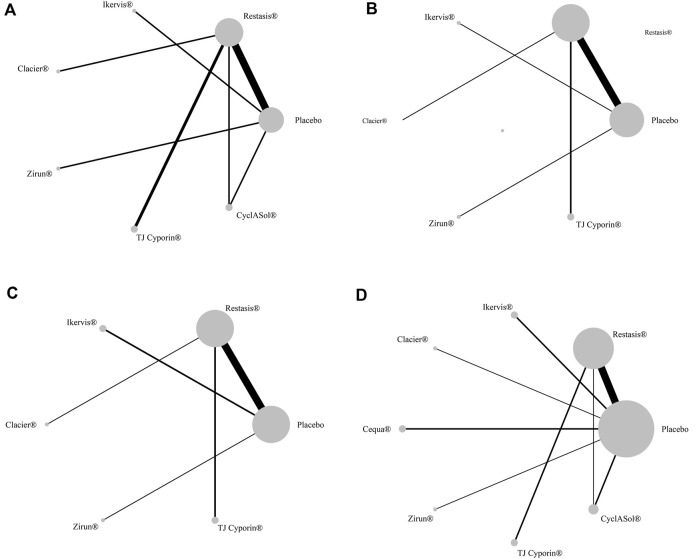
FIGURE 4.
Network comparison of the four indicators. (A): ocular surface disease index (OSDI) change from baseline; (B): Schirmer’s test (ST) change from baseline; (C): tear film break-up time (BUT) change from baseline; (D): Treatment-emergent AEs (TEAEs). The node size represents the sample size of intervention measures, and the line represents the number of RCTs between the two intervention measures.

