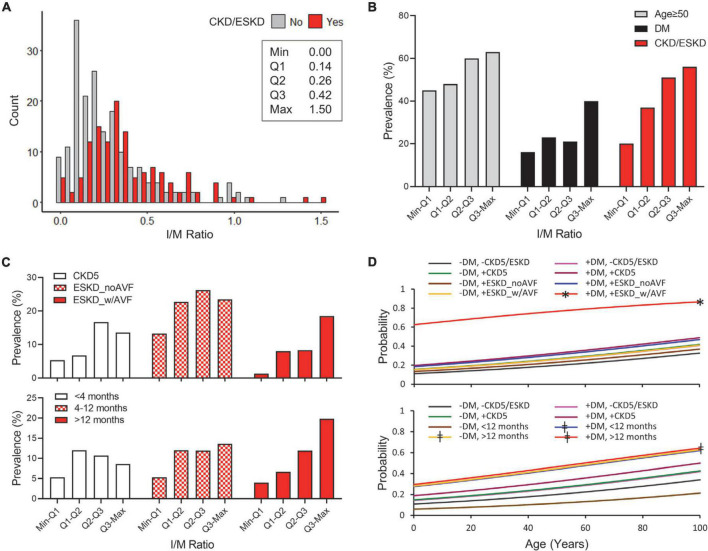
FIGURE 1.
Predictors of high intimal hyperplasia (IH) in CKD and non-CKD veins. (A) Histogram of IH expressed as intima/media area ratio in CKD/ESKD and non-CKD veins. The minimum, first quartile (Q1), median (Q2), third quartile (Q3), and maximum values are indicated for the overall study cohort. (B) Prevalence of age ≥ 50 years, diabetes, and CKD/ESKD per quartile of IH in the overall study cohort. (C) Distribution of CKD and ESKD subgroups per quartile of IH according to disease stage and vascular access history (Top) or dialysis vintage (Bottom). (D) Probability of IH falling in the upper quartile values (≥0.42) as predicted by age and combined status of diabetes and CKD/ESKD stages. CKD subgroups are separated according to disease stage and vascular access history (Top) or dialysis vintage (Bottom). DM, diabetes; CKD5, stage 5 CKD; ESKD_noAVF, ESKD without previous AVF or AVG; ESKD_w/AVF, ESKD and previous AVF/AVG history. *p < 0.05 vs. all individual models, ‡p < 0.05 vs. (–) DM/(–)CKD5/ESKD and (–) DM/ < 12 months.

