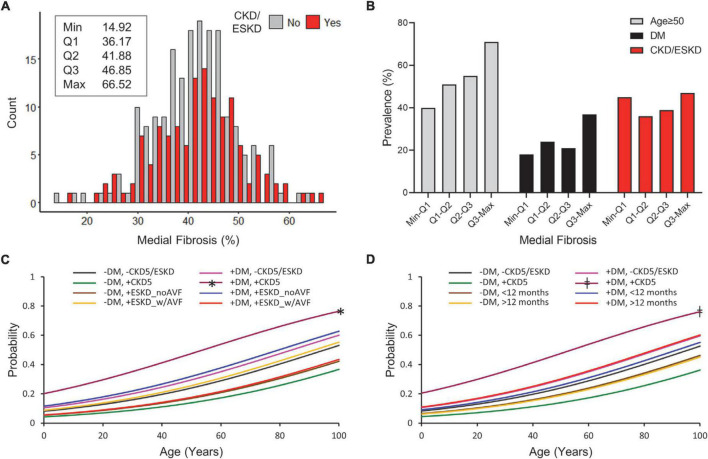
FIGURE 2.
Predictors of high medial fibrosis in CKD and non-CKD veins. (A) Histogram of percent medial fibrosis in CKD/ESKD and non-CKD veins. The minimum, first quartile (Q1), median (Q2), third quartile (Q3), and maximum values are indicated for the overall study cohort. (B) Prevalence of age ≥ 50 years, diabetes, and CKD/ESKD per quartile of medial fibrosis in the overall study cohort. (C,D) Probability of medial fibrosis falling in the upper quartile values (≥46.85%) as predicted by age and combined status of diabetes and CKD/ESKD stages. CKD subgroups are separated according to disease stage and vascular access history (C) or dialysis vintage (D). DM, diabetes; CKD5, stage 5 CKD; ESKD_noAVF, ESKD without previous AVF or AVG; ESKD_w/AVF, ESKD and previous AVF/AVG history. *p < 0.05 vs. (–) DM/(+) CKD5 and (–) DM/(+) ESKD_noAVF, ‡p < 0.05 vs. (–) DM/(+)CKD5 and (–) DM/ < 12 months.

