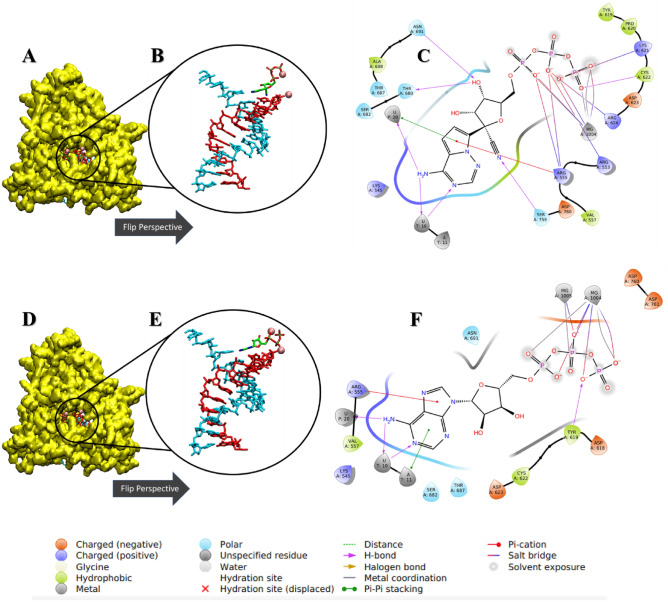
Figure 3.
Ligand–receptor interaction diagrams and representations of the most abundant conformational pose from MD simulation. (A,D) The 3D surface representation of SARS-CoV-2 RdRp colored in yellow. (B,E) Zoomed and rotated perspective of the template-primer RNA in complex with ATP and RTP, respectively. (C,F) The detailed receptor-RNA-ligand contacts of the most abundant conformational pose of ATP and RTP, respectively. Template and primer strands represented in blue and red licorice, respectively. Ligands are colored in green and magnesium ions are represented as pink balls.

