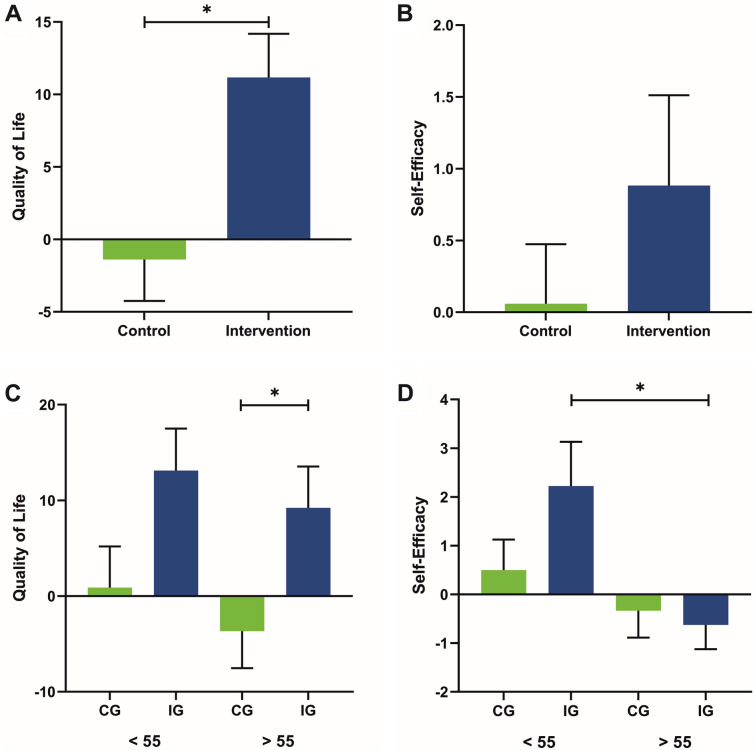
Fig. 2.
A Quality of life (QoL) in waitlist control (M = − 1.389, SE = 2.857) and intervention phase (M = 11.167, SE = 3.019). B Self-efficacy in waitlist control (M = 0.059, SE = 0.415) and intervention phase (M = 0.882, SE = 0.629). C QoL of patients under 55 years of age in waitlist control (CG; M = 0.889, SE = 4.289) and intervention phase (IG; M = 13.111, SE = 4.389) and of over 55 year-old patients in waitlist control (M = − 3.667, SE = 3.873) and intervention phase (M = 9.222, SE = 4.307). D Self-efficacy of patients under 55 years of age in waitlist control (M = 0.50, SE = 0.627) and intervention phase (M = 2.222, SE = 0.909) and of over 55 year-old patients in waitlist control (M = − 0.333, SE = 0.552) and intervention phase (M = − 0.625, SE = 0.498). Error bars show the standard errors (SE). *p < 0.05

