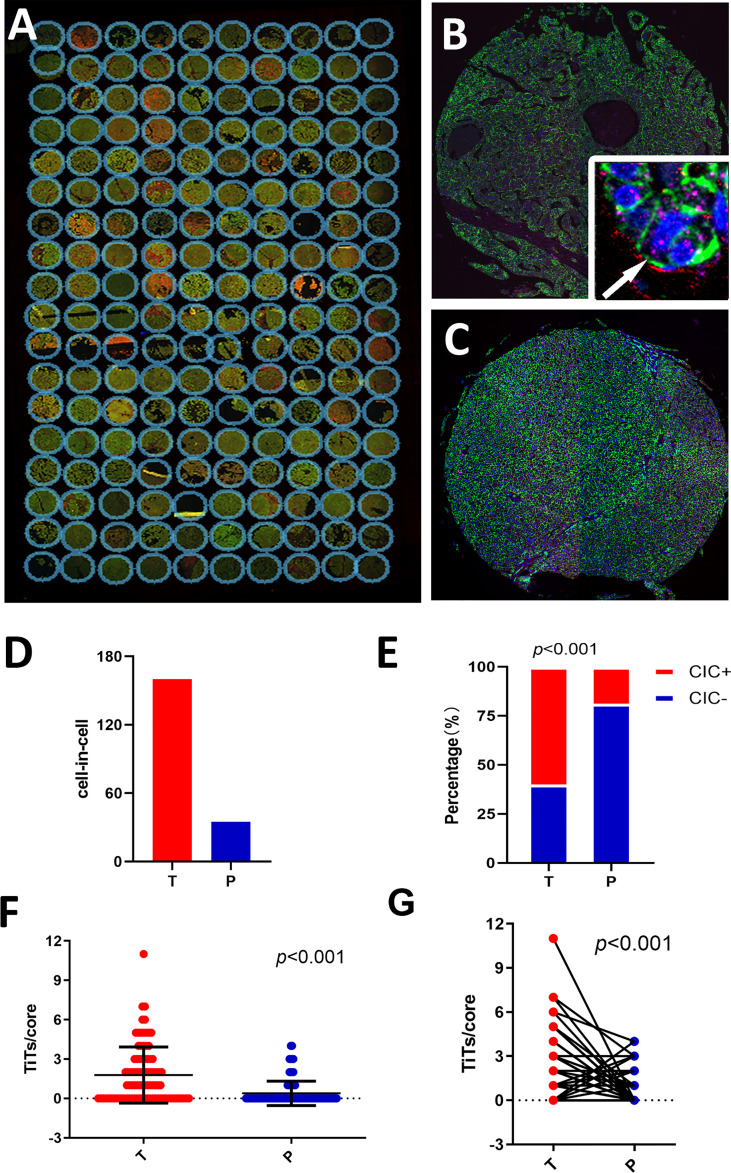
Figure 1.
Detecting homotypic CICs in a tissue microarray (TMA) of human HCC. (A) Composite images of a whole TMA slide stained with antibodies against E-cadherin (green), CD44 (red), CD45 (pink), and DAPI staining of the nucleus (blue). (B) Single representative tumor tissue (T) core. The arrow in the inserted image shows one typical CIC. (C) Para-tumor tissue core (P). (D) CIC counts in tumor and para-tumor tissues. (E) Percentages of patients with or without CICs in tumor and non-tumor tissues. (F) CICs detected in 90 tumor cores and paired para-tumor tissue cores. (G) CICs presented as number of CICs per core in the tumor and non-tumor tissues.

