Figure 3.

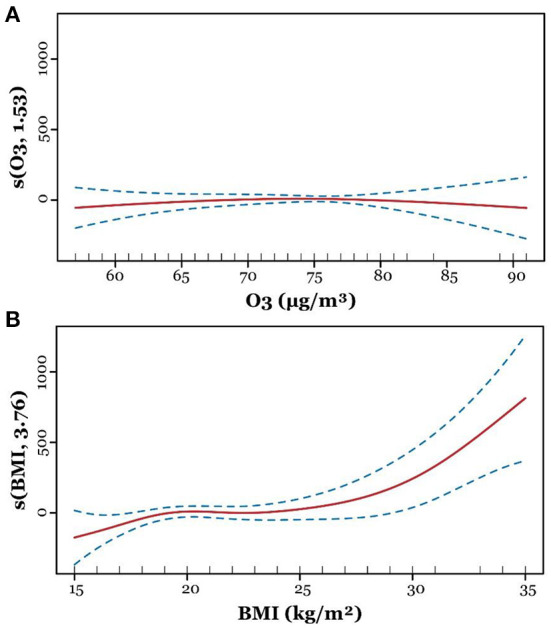
Adjusted generalized additive model for ozone and body mass index (BMI). After adjusting confounders, the line plots show smoothing functions with 95% confidence intervals for the association between birth weight and ozone (A) and BMI (B).

Adjusted generalized additive model for ozone and body mass index (BMI). After adjusting confounders, the line plots show smoothing functions with 95% confidence intervals for the association between birth weight and ozone (A) and BMI (B).