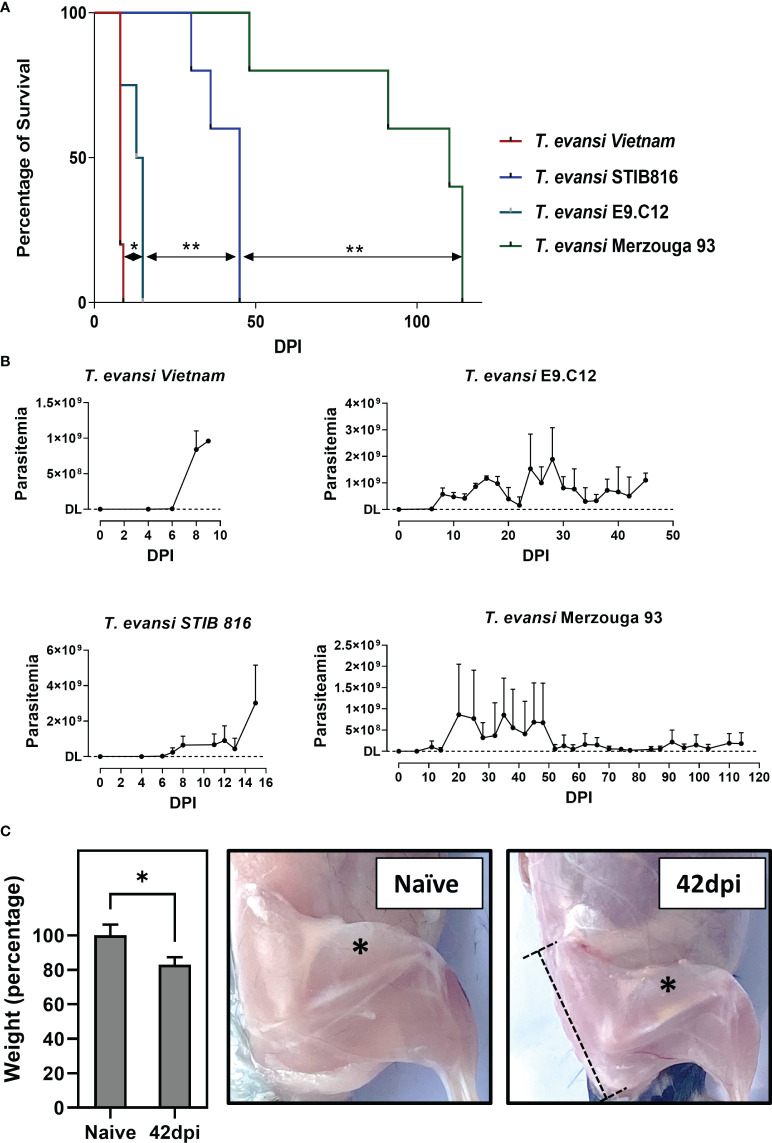
Figure 1.
Chronic infection by T. evansi Merzouga 93 is similar to infections in domestic animals. (A) Survival curve of 4 representative isolates: T. evansi Vietnam (hyper-virulent), T. evansi STIB816 (virulent), T. evansi E9.C12 (intermediate), and T. evansi Merzouga 93 (chronic). *p≤ 0.05, **p≤ 0.01 by Log-rank test. (B) Parasitemia profiles of 4 isolates during infection. Data are presented as mean + SD from 5 individual mice per group. The Y axis indicates the number of parasites, DL: detection limit (4x10⁵ parasites/ml blood). (C) Left panel: Weight reduction in percentage of infected mice (42dpi) relative to naïve mice. Data is presented as mean + SD of mice’s body weight after subtracting the weight of spleen and liver. *p ≤ 0.05 by Student t-test vs naïve values. Right panels: Catabolic muscle breakdown observed during chronic infection of T. evansi Merzouga 93. The asterisk indicates the location of quadriceps muscle, the dashed bar indicates the location of the Pelvis bone.

