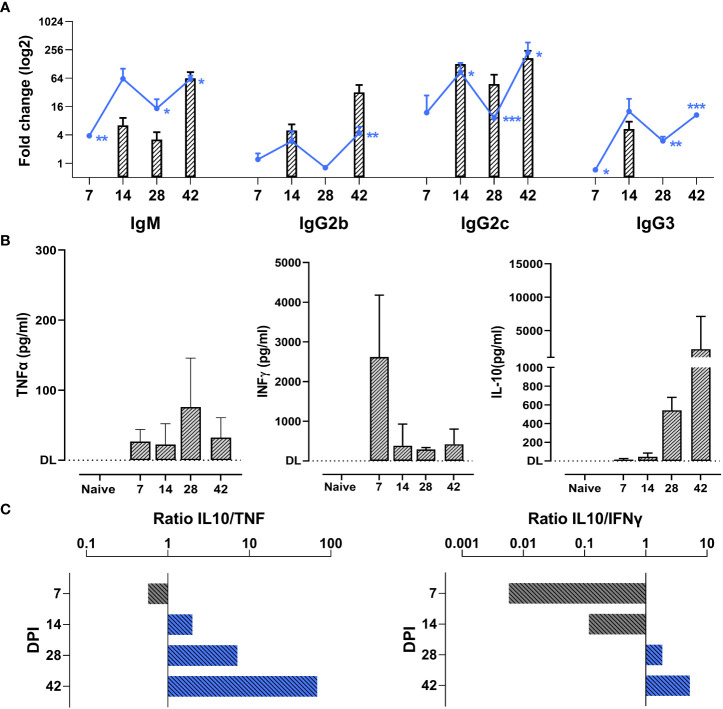
Figure 2.
Chronic T. evansi Merzouga 93 infection hallmarked by high antibody titers and anti-inflammatory cytokine response. (A) Total antibodies titers (line graphs) and anti-VSG antibodies titers (bar graphs). Results present log2 fold change of OD50 values (for total antibodies) or end-point titer (for anti-VSG antibodies) of infected mice vs naïve sample. For anti-VSG antibodies titers, only significant values when compared with naïve (p≤ 0.05) are presented. *p ≤ 0.05; **p ≤ 0.01, ***p ≤ 0.001 by Student t-test vs naïve values. (B) Concentration of TNFα, INFɣ, and IL-10 in blood plasma during infection. DL: detection limit. Data presents mean + SD from 3 individual mice from one representative among three independent experiments. (C) IL-10/TNFα and IL-10/INFɣ ratios, computed by dividing the average IL-10 concentration by the average TNF and INFγ concentrations at the same time point.

