Figure 3.
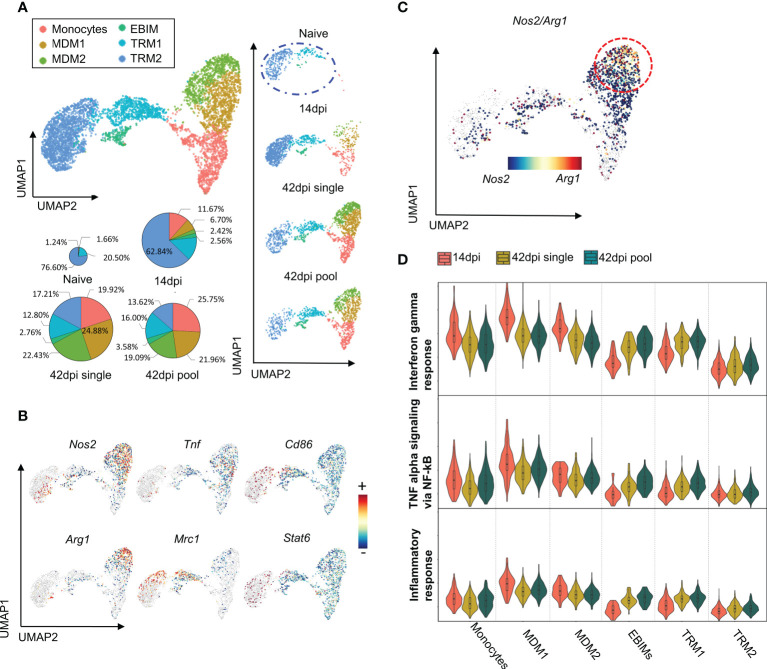
scRNA-seq analysis reveals heterogeneity of Macrophages population during early and late stage of T. evansi infection. (A) Uniform Manifold Approximation Projection (UMAP) of Macrophages sub-populations and their portion across 3 time points (pie charts). MDM: Monocytes Derived Macrophages, EBIM: Erythroblast Island Macrophages, TRM: Tissue Resident Macrophages. (B) Log-normalized expression of classical markers for M1 (upper panel) and M2 (lower panel) macrophages on combined Macrophages from 3 time points. (C) Co-expression levels of Nos2/Arg1 genes on 42dpi single and 42dpi pool datasets derived Macrophages. (D) Interferon gamma response score (Top panel), TNF alpha signaling via NF-kB score (Middle panel), and Inflammation response score (Bottom panel) of Macrophages sub-populations during infection.

