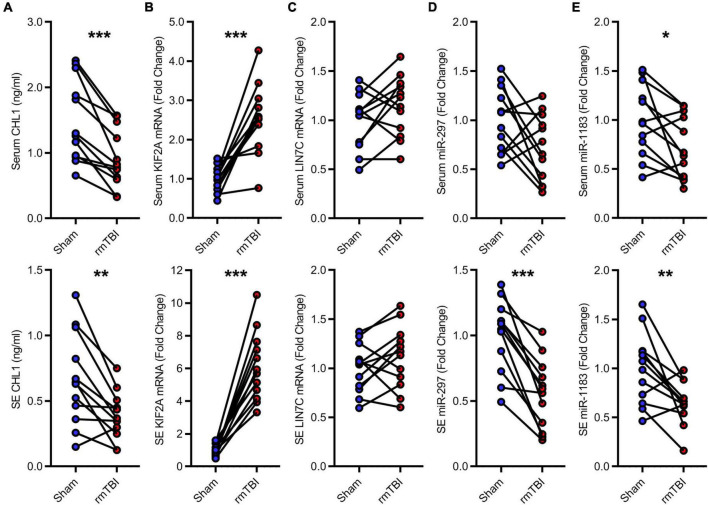
FIGURE 5.
Low-throughput assays for candidate diagnostic biomarkers for CTE. (A) Quantitative data of ELISA for serum and exosomal CHL1 level in indicated groups. (B–E) Quantitative data of RT-PCR for serum and exosomal KIF2A, LIN7C, hsa-miR-297, hsa-miR-1183. n = 12 per group. Mean ± SD. *P < 0.05, **P < 0.01, ***P < 0.001. Statistical analyses were performed using two-tailed paired Student’s t-test. SE, serum exosomes.

