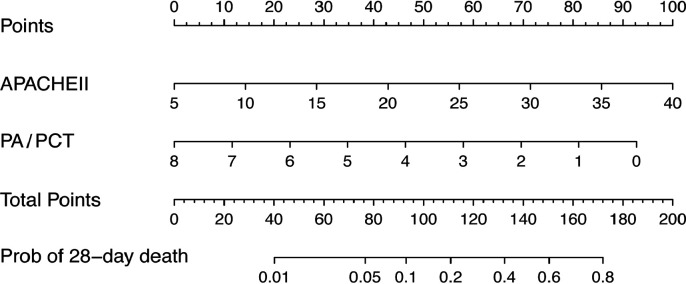
Figure 2.
Nomogram to calculate risk score and predict 28-day mortality. Scores were assigned for APACHE II and PA/PCT by drawing a line upward from the corresponding values to the ‘points’ line. The sum of all these scores, plotted on the ‘total points’ line, corresponds to predictions of 28-day mortality risk in critically ill patients. APACHE II, Acute Physiology and Chronic Health Evaluation II; PA, prealbumin; PCT, procalcitonin.

