Figure 3.
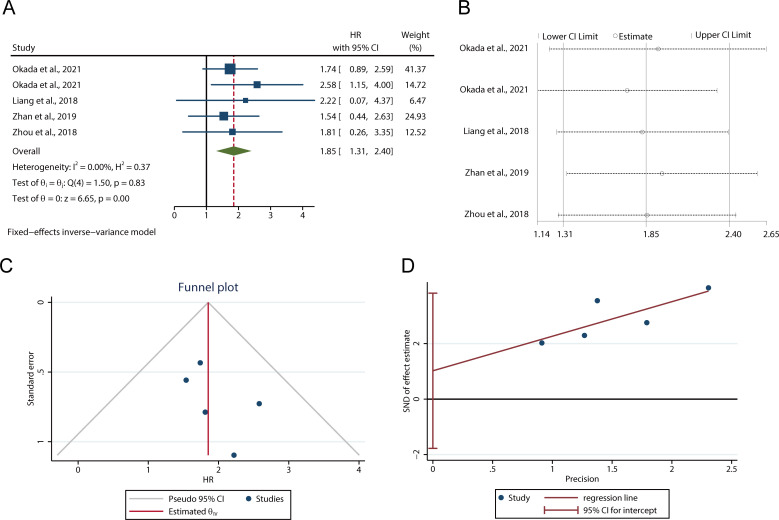
The relationship between LAMC2 expression and OS/PFS/DSS. (A) Forest plot for the meta-analysis of OS/PFS/DSS. (B) Sensitivity analysis for LAMC2 expression with OS/PFS/DSS. (C) Funnel plot for the meta-analysis of OS/PFS/DSS. (D) Egger’s graph for analysing publication bias. DSS, disease-specific survival; OS, overall survival; PFS, progression-free survival.

