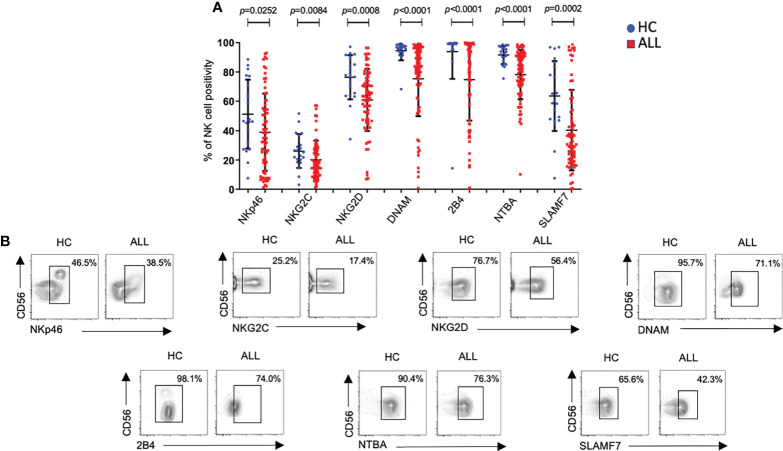
Figure 1.
Percentages of NK cells expressing distinct activating receptors from ALL patients and healthy controls. (A) The frequencies of CD3-CD20-CD14-CD56+ cells expressing distinct activating receptors were analyzed by flow cytometry in 72 ALL patients and 21 healthy controls. Vertical lines indicate standard deviation. The horizonal lines represents the mean value. P values reports significance according to U-Mann Whitney Test one-tail. HC: healthy controls; ALL: Acute lymphoblastic leukemia patients. (B) Representative FACS plots depict the percentage of CD3-CD20-CD14-CD56+ cells expressing distinct activating receptors from healthy controls (n = 21) and ALL patients (n = 72). HC: healthy controls; ALL: Acute lymphoblastic leukemia patients.

