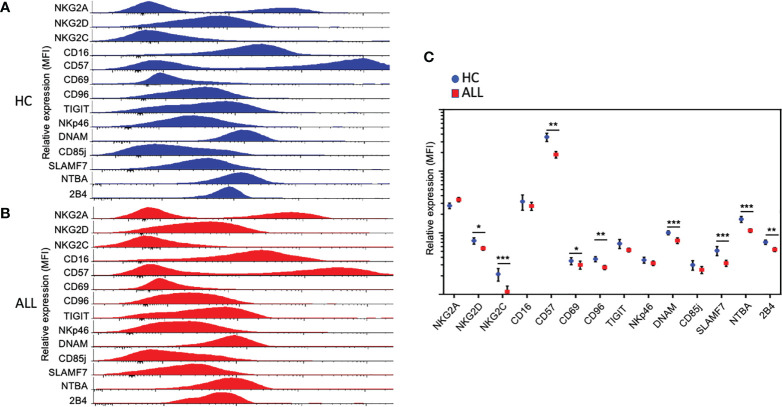
Figure 2.
Relative expression of activating and inhibitory receptors on NK cells. Relative expression, represented as the mean fluorescence intensity (MFI), of activating and inhibitory receptors in NK cells from total healthy controls (n = 21) (A) and ALL patients (n = 62) (B). Histograms cover all the values obtained for each control and patient as indicated. (C) Summary of data for frequencies of NK cell expressing distinct activating and inhibitory receptors from21 healthy controls and 62 ALL patients. The vertical lines indicate standard deviation. The horizonal lines represent the mean value. Results were considered significant at * p< 0.05, ** p < 0.01 and *** p < 0.001.

