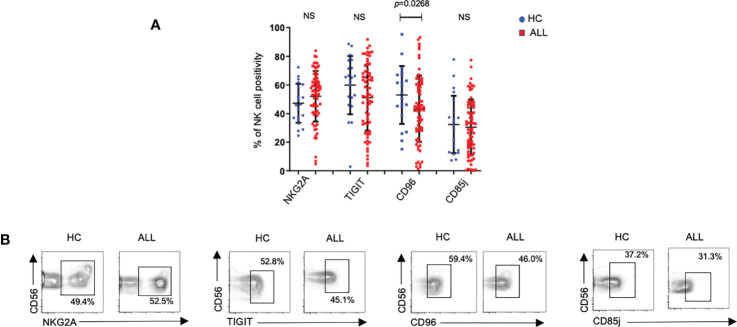
Figure 3.
Percentages of NK cells expressing distinct inhibitory receptors on NK cells form healthy controls and ALL patients. (A) The frequencies of CD3-CD20-C14-CD56+ cells expressing distinct inhibitory receptors were analyzed by flow cytometry in 72 ALL patients and 21 healthy controls. Vertical lines indicate standard deviation. The horizonal lines represents the mean value. (B) Representative FACS plots depict the percentage of CD3-CD20-CD14-CD56+ expressing distinct inhibitory receptors on NK cells from healthy controls (n= 21) and ALL patients (n= 72). HC: healthy controls; ALL: Acute lymphoblastic leukemia patients. NS, Not Significant.

